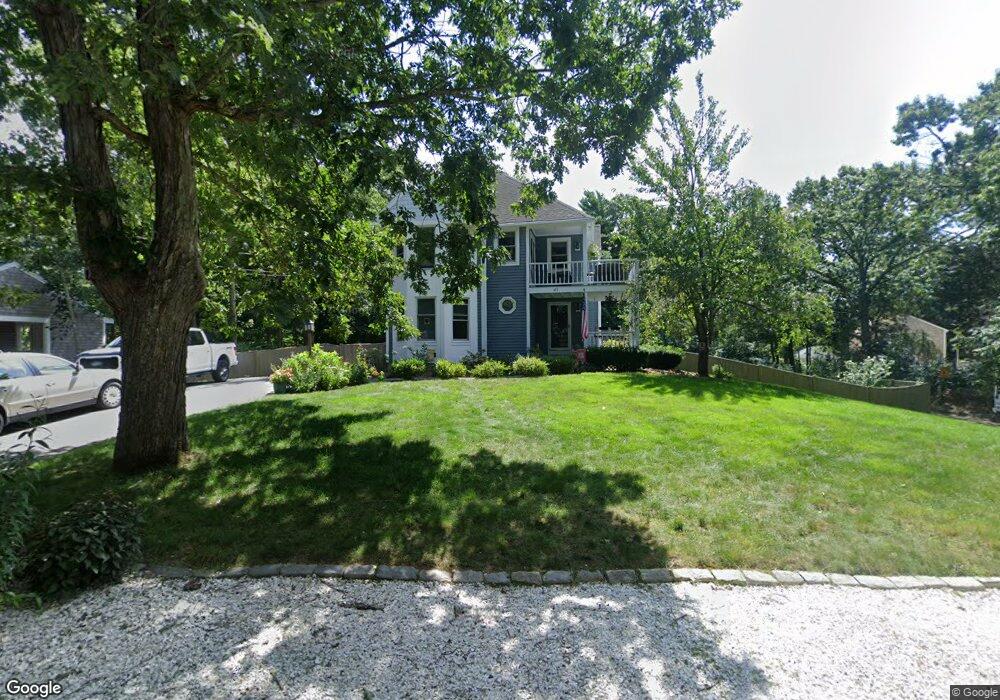
41 Tower Rd Plymouth, MA 02360
Estimated Value: $702,662 - $771,000
3
Beds
2
Baths
2,048
Sq Ft
$362/Sq Ft
Est. Value
About This Home
This home is located at 41 Tower Rd, Plymouth, MA 02360 and is currently estimated at $741,416, approximately $362 per square foot. 41 Tower Rd is a home located in Plymouth County with nearby schools including Nathaniel Morton Elementary School, Plymouth Community Intermediate, and Plymouth North High School.
Ownership History
Date
Name
Owned For
Owner Type
Purchase Details
Closed on
Nov 4, 2011
Sold by
Roy Amanda M and Connors John T
Bought by
Maynard Garrick
Current Estimated Value
Home Financials for this Owner
Home Financials are based on the most recent Mortgage that was taken out on this home.
Original Mortgage
$301,242
Outstanding Balance
$206,012
Interest Rate
4.08%
Mortgage Type
Purchase Money Mortgage
Estimated Equity
$535,404
Purchase Details
Closed on
May 31, 2005
Sold by
Lafond Philip J and Lafond Stephanie I
Bought by
Roy Amanda M and Connors John T
Home Financials for this Owner
Home Financials are based on the most recent Mortgage that was taken out on this home.
Original Mortgage
$308,000
Interest Rate
5.94%
Mortgage Type
Purchase Money Mortgage
Purchase Details
Closed on
Sep 30, 1996
Sold by
Martinelli Jean P
Bought by
Davison Robert S and Davison Fiona K
Create a Home Valuation Report for This Property
The Home Valuation Report is an in-depth analysis detailing your home's value as well as a comparison with similar homes in the area
Home Values in the Area
Average Home Value in this Area
Purchase History
| Date | Buyer | Sale Price | Title Company |
|---|---|---|---|
| Maynard Garrick | $295,000 | -- | |
| Roy Amanda M | $385,000 | -- | |
| Davison Robert S | $170,000 | -- |
Source: Public Records
Mortgage History
| Date | Status | Borrower | Loan Amount |
|---|---|---|---|
| Open | Maynard Garrick | $301,242 | |
| Previous Owner | Davison Robert S | $108,000 | |
| Previous Owner | Davison Robert S | $308,000 |
Source: Public Records
Tax History Compared to Growth
Tax History
| Year | Tax Paid | Tax Assessment Tax Assessment Total Assessment is a certain percentage of the fair market value that is determined by local assessors to be the total taxable value of land and additions on the property. | Land | Improvement |
|---|---|---|---|---|
| 2025 | $7,236 | $570,200 | $238,100 | $332,100 |
| 2024 | $6,828 | $530,500 | $213,100 | $317,400 |
| 2023 | $6,490 | $473,400 | $186,100 | $287,300 |
| 2022 | $6,157 | $399,000 | $171,000 | $228,000 |
| 2021 | $6,134 | $379,600 | $171,000 | $208,600 |
| 2020 | $6,202 | $379,300 | $171,000 | $208,300 |
| 2019 | $5,806 | $351,000 | $141,000 | $210,000 |
| 2018 | $5,776 | $350,900 | $141,000 | $209,900 |
| 2017 | $5,448 | $328,600 | $141,000 | $187,600 |
Source: Public Records
Map
Nearby Homes
- 41 Bay Shore Dr
- 106 Rocky Hill Rd
- 157 Bay Shore Dr
- 12 State Rd Unit 3D
- 12 State Rd Unit 4D
- 24 Country Club Dr Unit 24
- 4 Lady Bug Ln
- 3 Lady Bug Ln
- 9 Sunflower Way
- 50 Clifford Rd
- 19 Langford Rd
- 30 Langford Rd
- 18 River St
- 122 Clifford Rd
- 4 Priscilla Beach Rd
- 46 Sandwich Rd Unit 26
- 46 Sandwich Rd Unit 36
- 46 Sandwich Rd Unit 14
- 46 Sandwich Rd Unit 6
- 46 Sandwich Rd Unit 34