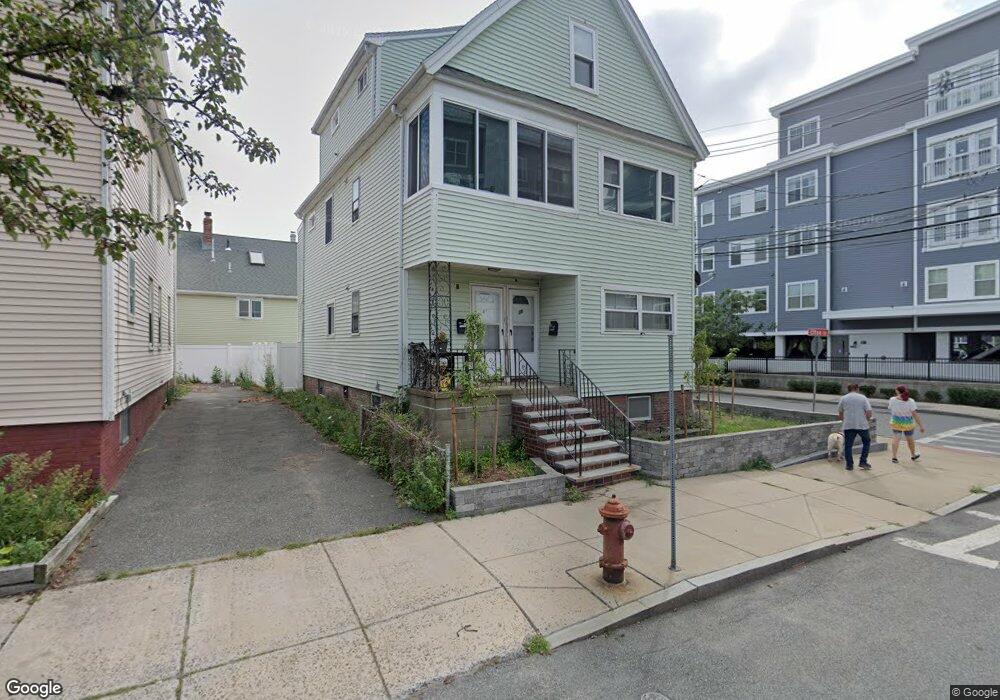
41 Tremont St Everett, MA 02149
West Everett NeighborhoodEstimated Value: $803,592 - $990,000
5
Beds
3
Baths
2,400
Sq Ft
$360/Sq Ft
Est. Value
About This Home
This home is located at 41 Tremont St, Everett, MA 02149 and is currently estimated at $863,648, approximately $359 per square foot. 41 Tremont St is a home located in Middlesex County with nearby schools including Everett High School, Pioneer Charter School of Science, and St Anthony School.
Ownership History
Date
Name
Owned For
Owner Type
Purchase Details
Closed on
Aug 29, 2023
Sold by
Brooks Dawn R
Bought by
Dawn R Brks Ret 2023 and Brooks
Current Estimated Value
Create a Home Valuation Report for This Property
The Home Valuation Report is an in-depth analysis detailing your home's value as well as a comparison with similar homes in the area
Home Values in the Area
Average Home Value in this Area
Purchase History
We collect this data history from publicly available records. To have your information removed, we recommend requesting removal directly through your county’s website.
| Date | Buyer | Sale Price | Title Company |
|---|---|---|---|
| Dawn R Brks Ret 2023 | -- | None Available |
Source: Public Records
Tax History
| Year | Tax Paid | Tax Assessment Tax Assessment Total Assessment is a certain percentage of the fair market value that is determined by local assessors to be the total taxable value of land and additions on the property. | Land | Improvement |
|---|---|---|---|---|
| 2025 | $8,547 | $750,400 | $231,000 | $519,400 |
| 2024 | $7,642 | $666,800 | $187,600 | $479,200 |
| 2023 | $7,447 | $632,200 | $178,400 | $453,800 |
| 2022 | $6,138 | $592,500 | $172,000 | $420,500 |
| 2021 | $5,262 | $533,100 | $172,000 | $361,100 |
| 2020 | $5,539 | $520,600 | $172,000 | $348,600 |
| 2019 | $5,859 | $473,300 | $163,800 | $309,500 |
| 2018 | $5,739 | $416,500 | $142,700 | $273,800 |
| 2017 | $5,312 | $367,900 | $119,000 | $248,900 |
| 2016 | $4,808 | $332,700 | $109,800 | $222,900 |
| 2015 | $4,541 | $310,800 | $103,200 | $207,600 |
Source: Public Records
Map
Nearby Homes
- 233 Main St
- 71 Winslow St
- 39 Parlin St Unit 503
- 39 Parlin St Unit 207
- 39 Parlin St Unit 203
- 17 Dyer Ave
- 16 Woodville St
- 59 Woodville St
- 19 Bradford St
- 41 Winthrop St
- 68 Linden St Unit 49
- 53 Winthrop St
- 20 Hatch St
- 71 Wellington Ave Unit 2
- 17 Tufts Ave
- 9 Carter St
- 120 Wyllis Ave Unit 403
- 120 Wyllis Ave Unit 103
- 15 Dean St
- 24 Corey St Unit 201
Your Personal Tour Guide
Ask me questions while you tour the home.