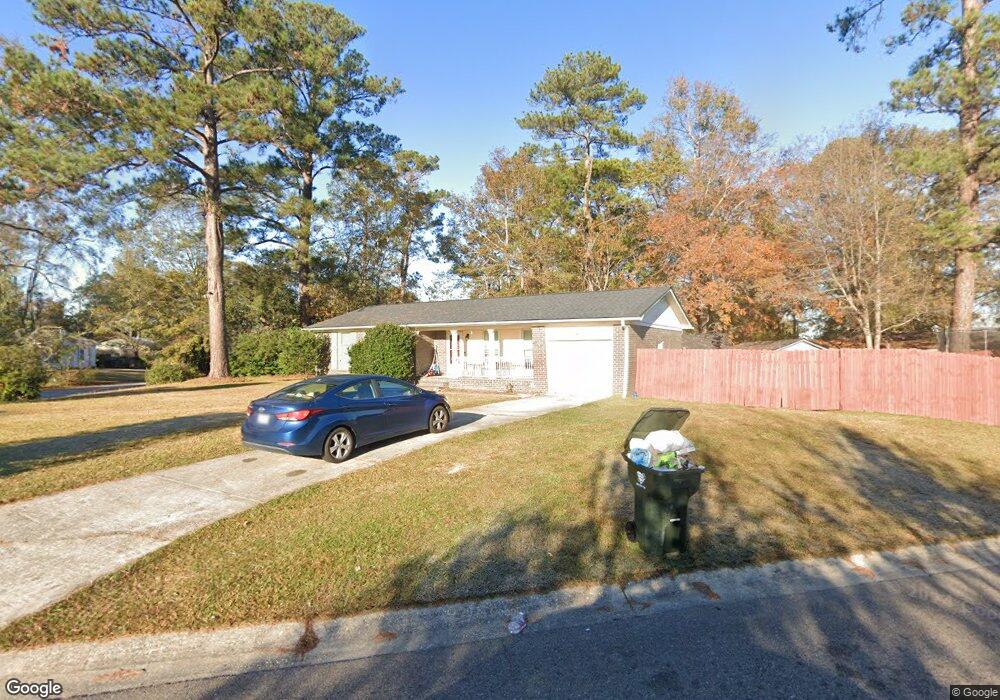
41 University Dr Ladson, SC 29456
Estimated Value: $241,000 - $265,000
3
Beds
2
Baths
1,108
Sq Ft
$233/Sq Ft
Est. Value
About This Home
This home is located at 41 University Dr, Ladson, SC 29456 and is currently estimated at $257,924, approximately $232 per square foot. 41 University Dr is a home located in Berkeley County with nearby schools including College Park Elementary School, College Park Middle School, and Stratford High School.
Ownership History
Date
Name
Owned For
Owner Type
Purchase Details
Closed on
Aug 16, 2012
Sold by
Federal Home Loan Mortgage Corporation
Bought by
Barnes Denise M
Current Estimated Value
Home Financials for this Owner
Home Financials are based on the most recent Mortgage that was taken out on this home.
Original Mortgage
$77,634
Interest Rate
3.64%
Mortgage Type
VA
Purchase Details
Closed on
Apr 18, 2012
Sold by
Moreno Candida J
Bought by
Federal Home Loan Mortgage Corporation
Purchase Details
Closed on
Jan 19, 2005
Sold by
Loor Beder L and Pizzaro Mirian E
Bought by
Moreno Candida J
Home Financials for this Owner
Home Financials are based on the most recent Mortgage that was taken out on this home.
Original Mortgage
$91,800
Interest Rate
8.1%
Mortgage Type
Adjustable Rate Mortgage/ARM
Purchase Details
Closed on
Mar 24, 2004
Sold by
Rhoades Marilyn E
Bought by
Pizarro Mirian and Loor Beder
Create a Home Valuation Report for This Property
The Home Valuation Report is an in-depth analysis detailing your home's value as well as a comparison with similar homes in the area
Home Values in the Area
Average Home Value in this Area
Purchase History
| Date | Buyer | Sale Price | Title Company |
|---|---|---|---|
| Barnes Denise M | $76,000 | -- | |
| Federal Home Loan Mortgage Corporation | $2,500 | -- | |
| Moreno Candida J | $108,000 | -- | |
| Pizarro Mirian | $82,900 | -- |
Source: Public Records
Mortgage History
| Date | Status | Borrower | Loan Amount |
|---|---|---|---|
| Previous Owner | Barnes Denise M | $77,634 | |
| Previous Owner | Moreno Candida J | $91,800 |
Source: Public Records
Tax History Compared to Growth
Tax History
| Year | Tax Paid | Tax Assessment Tax Assessment Total Assessment is a certain percentage of the fair market value that is determined by local assessors to be the total taxable value of land and additions on the property. | Land | Improvement |
|---|---|---|---|---|
| 2025 | $1,885 | $121,406 | $22,735 | $98,671 |
| 2024 | $1,885 | $7,284 | $1,364 | $5,920 |
| 2023 | $1,885 | $7,284 | $1,364 | $5,920 |
| 2022 | $1,817 | $6,334 | $812 | $5,522 |
| 2021 | $1,830 | $6,330 | $812 | $5,522 |
| 2020 | $1,837 | $6,334 | $812 | $5,522 |
| 2019 | $1,833 | $6,334 | $812 | $5,522 |
| 2018 | $1,706 | $5,508 | $1,200 | $4,308 |
| 2017 | $1,707 | $5,508 | $1,200 | $4,308 |
| 2016 | $1,722 | $5,510 | $1,200 | $4,310 |
| 2015 | $1,644 | $5,510 | $1,200 | $4,310 |
| 2014 | $1,541 | $5,510 | $1,200 | $4,310 |
| 2013 | -- | $5,510 | $1,200 | $4,310 |
Source: Public Records
Map
Nearby Homes
- 380 Furman Ln
- 352 Oxford Rd
- 212 Hamlet Cir
- 75 University Dr
- 100 Sutton Ln
- 109 Waveney Cir
- 212 Columbia Dr
- 4042 Exploration Rd
- 125 Eston Dr
- 116 Ashley Hill Dr
- 1343 Discovery Dr
- 1110 Wilhite Dr
- 1084 Wilhite Dr
- 1273 Discovery Dr
- 1391 Hermitage Ln
- 107 Tall Pines Rd
- 102 David John Ct
- 105 N Gateshead Crossing
- 607 Piedmont Ln
- 172 Thousand Oaks Cir
- 100 Clemson Ct
- 43 University Dr
- 102 Clemson Ct
- 621 College Park Rd
- 101 Olde Clemson Ct
- 101 Clemson Ct
- 45 University Dr
- 103 Olde Clemson Ct
- 103 Clemson Ct
- 104 Clemson Ct
- 105 Clemson Ct
- 103 Yale Dr
- 617 College Park Rd
- 101 Yale Dr
- 105 Yale Dr
- 47 University Dr
- 324 Oxford Rd
- 326 Oxford Rd
- 107 Yale Dr
- 615 College Park Rd