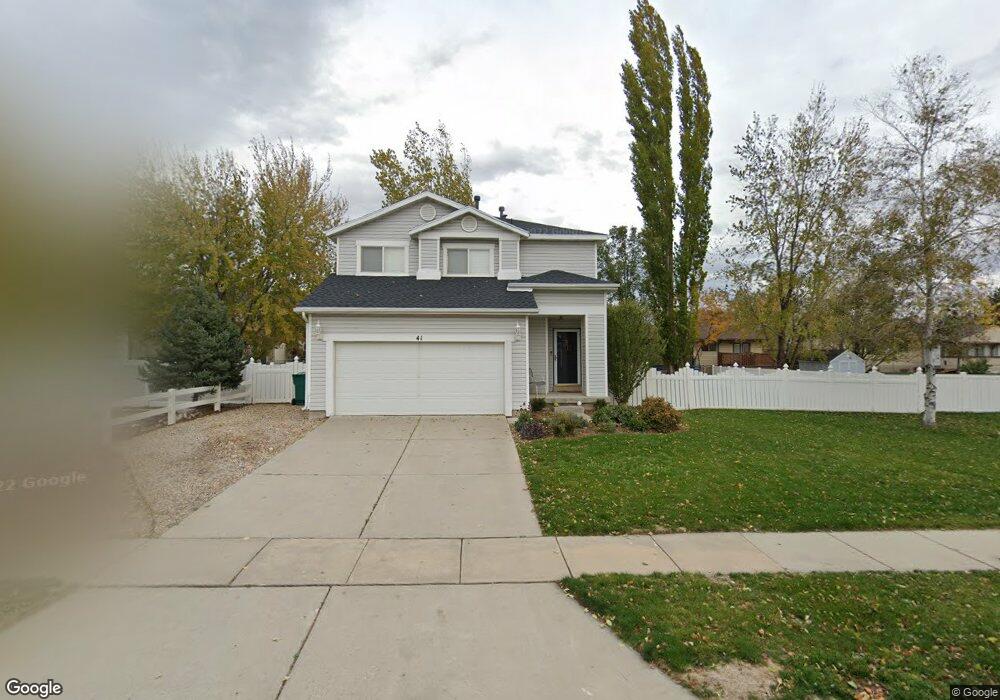
41 W 850 S Layton, UT 84041
Estimated Value: $437,000 - $447,090
3
Beds
3
Baths
1,290
Sq Ft
$343/Sq Ft
Est. Value
About This Home
This home is located at 41 W 850 S, Layton, UT 84041 and is currently estimated at $442,023, approximately $342 per square foot. 41 W 850 S is a home located in Davis County with nearby schools including Layton Elementary School, Fairfield Junior High School, and Davis High School.
Ownership History
Date
Name
Owned For
Owner Type
Purchase Details
Closed on
Mar 5, 2020
Sold by
Chidester John and Chidester Amber
Bought by
Stauffer Taylor Brian and Stauffer Katie Ann
Current Estimated Value
Home Financials for this Owner
Home Financials are based on the most recent Mortgage that was taken out on this home.
Original Mortgage
$253,000
Outstanding Balance
$224,014
Interest Rate
3.6%
Mortgage Type
New Conventional
Estimated Equity
$218,009
Purchase Details
Closed on
May 26, 2016
Sold by
Sales Ivy M
Bought by
Chidester John and Chidester Amber
Purchase Details
Closed on
Jan 28, 2000
Sold by
Sales Ivy M
Bought by
Sales Ivy M
Purchase Details
Closed on
Aug 30, 1999
Sold by
Kaufman & Broad Of Utah Inc
Bought by
Sales Ivy N
Home Financials for this Owner
Home Financials are based on the most recent Mortgage that was taken out on this home.
Original Mortgage
$124,201
Interest Rate
7.47%
Mortgage Type
FHA
Create a Home Valuation Report for This Property
The Home Valuation Report is an in-depth analysis detailing your home's value as well as a comparison with similar homes in the area
Home Values in the Area
Average Home Value in this Area
Purchase History
| Date | Buyer | Sale Price | Title Company |
|---|---|---|---|
| Stauffer Taylor Brian | -- | Vanguard Title Insurance | |
| Chidester John | -- | Real Advantage Title | |
| Sales Ivy M | -- | First American Title Co | |
| Sales Ivy N | -- | First American Title Co |
Source: Public Records
Mortgage History
| Date | Status | Borrower | Loan Amount |
|---|---|---|---|
| Open | Stauffer Taylor Brian | $253,000 | |
| Previous Owner | Sales Ivy N | $124,201 |
Source: Public Records
Tax History Compared to Growth
Tax History
| Year | Tax Paid | Tax Assessment Tax Assessment Total Assessment is a certain percentage of the fair market value that is determined by local assessors to be the total taxable value of land and additions on the property. | Land | Improvement |
|---|---|---|---|---|
| 2025 | $2,196 | $230,450 | $107,311 | $123,139 |
| 2024 | $2,112 | $223,300 | $119,442 | $103,858 |
| 2023 | $2,033 | $379,000 | $116,719 | $262,281 |
| 2022 | $2,206 | $223,300 | $73,986 | $149,314 |
| 2021 | $1,954 | $295,000 | $111,011 | $183,989 |
| 2020 | $1,768 | $256,000 | $93,095 | $162,905 |
| 2019 | $1,622 | $230,000 | $96,424 | $133,576 |
| 2018 | $1,545 | $220,000 | $84,469 | $135,531 |
| 2016 | $1,319 | $96,910 | $32,727 | $64,183 |
| 2015 | $1,265 | $88,220 | $32,727 | $55,493 |
| 2014 | $1,239 | $88,336 | $32,727 | $55,609 |
| 2013 | -- | $90,951 | $24,816 | $66,135 |
Source: Public Records
Map
Nearby Homes
- 268 E 900 S
- 282 E 925 S
- 267 S Melody St
- 473 E Alice Way
- 174 W Dawson St
- 493 E Alice Way
- 774 W Farming Way
- 256 Seemore Dr
- 1429 W Lincoln Way
- 593 Kimball Dr
- 714 Rose Blossom Dr
- 877 S Main St Unit B
- 562 S 850 W
- 678 E Creekview Dr
- 617 E 405 S
- 895 S Main St Unit E
- 917 S Main St Unit H
- 2056 W Phillips St
- 747 E 425 S
- 71 S Harvs Ln