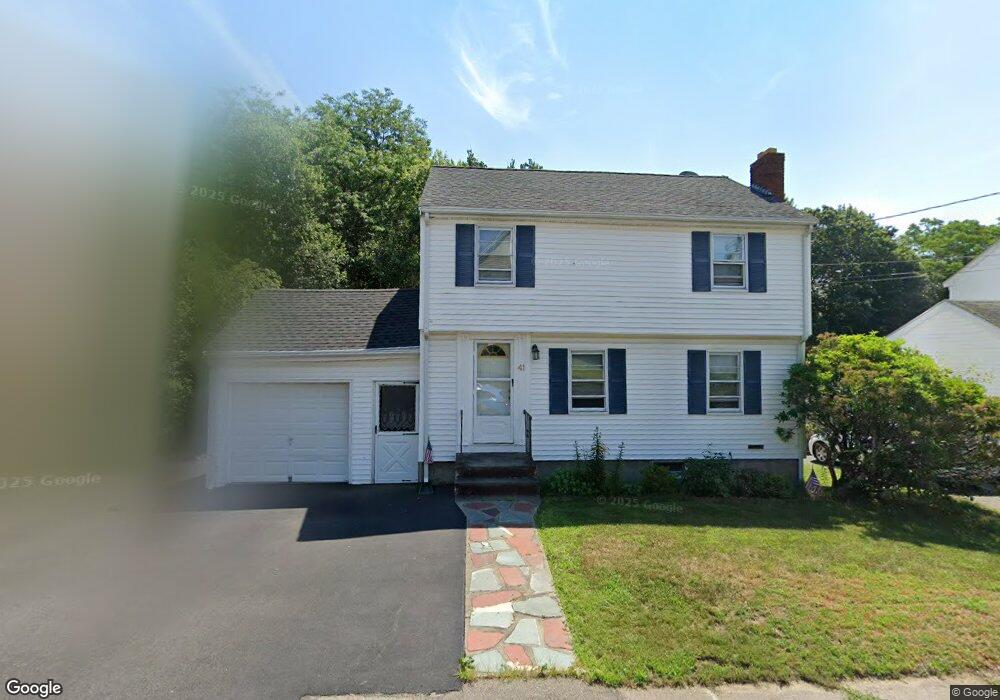
41 Wesson Ave Quincy, MA 02169
Estimated Value: $495,000 - $699,000
3
Beds
2
Baths
1,066
Sq Ft
$595/Sq Ft
Est. Value
About This Home
This home is located at 41 Wesson Ave, Quincy, MA 02169 and is currently estimated at $633,924, approximately $594 per square foot. 41 Wesson Ave is a home located in Norfolk County with nearby schools including South West Middle School, Lincoln-Hancock Community School, and Quincy High School.
Ownership History
Date
Name
Owned For
Owner Type
Purchase Details
Closed on
Aug 30, 2010
Sold by
Tse Yin and Wong Yee C
Bought by
Wong Hiu H and Wong Hiu L
Current Estimated Value
Purchase Details
Closed on
Sep 15, 1998
Sold by
Byrne Edward V
Bought by
Tse Yin
Home Financials for this Owner
Home Financials are based on the most recent Mortgage that was taken out on this home.
Original Mortgage
$122,720
Interest Rate
6.92%
Mortgage Type
Purchase Money Mortgage
Create a Home Valuation Report for This Property
The Home Valuation Report is an in-depth analysis detailing your home's value as well as a comparison with similar homes in the area
Home Values in the Area
Average Home Value in this Area
Purchase History
| Date | Buyer | Sale Price | Title Company |
|---|---|---|---|
| Wong Hiu H | -- | -- | |
| Tse Yin | $153,400 | -- |
Source: Public Records
Mortgage History
| Date | Status | Borrower | Loan Amount |
|---|---|---|---|
| Previous Owner | Tse Yin | $122,720 |
Source: Public Records
Tax History Compared to Growth
Tax History
| Year | Tax Paid | Tax Assessment Tax Assessment Total Assessment is a certain percentage of the fair market value that is determined by local assessors to be the total taxable value of land and additions on the property. | Land | Improvement |
|---|---|---|---|---|
| 2025 | $6,866 | $595,500 | $314,700 | $280,800 |
| 2024 | $6,481 | $575,100 | $299,900 | $275,200 |
| 2023 | $6,030 | $541,800 | $285,800 | $256,000 |
| 2022 | $5,554 | $463,600 | $229,100 | $234,500 |
| 2021 | $5,413 | $445,900 | $229,100 | $216,800 |
| 2020 | $5,218 | $419,800 | $229,100 | $190,700 |
| 2019 | $5,076 | $404,500 | $222,600 | $181,900 |
| 2018 | $4,996 | $374,500 | $206,300 | $168,200 |
| 2017 | $4,947 | $349,100 | $196,600 | $152,500 |
| 2016 | $4,633 | $322,600 | $179,000 | $143,600 |
| 2015 | $4,479 | $306,800 | $169,000 | $137,800 |
| 2014 | $4,388 | $295,300 | $169,000 | $126,300 |
Source: Public Records
Map
Nearby Homes
- 211 West St Unit 12B
- 63 Adele Rd
- 80 Woodcliff Rd
- 52 Bunker Hill Ln
- 36 Greystone St Unit 36
- 55 Station St Unit 1
- 808 Willard St Unit F11
- 42 West St
- 57A West St
- 2 Ricciuti Dr Unit 8
- 28 Miller St Unit 8
- 72 Centre St Unit J
- 203 Centre St
- 211 Copeland St
- 57 Buckley St
- 328 Copeland St Unit 3E
- 21 Totman St Unit 204
- 21 Totman St Unit 306
- 21 Totman St Unit 410
- 21 Totman St Unit 309