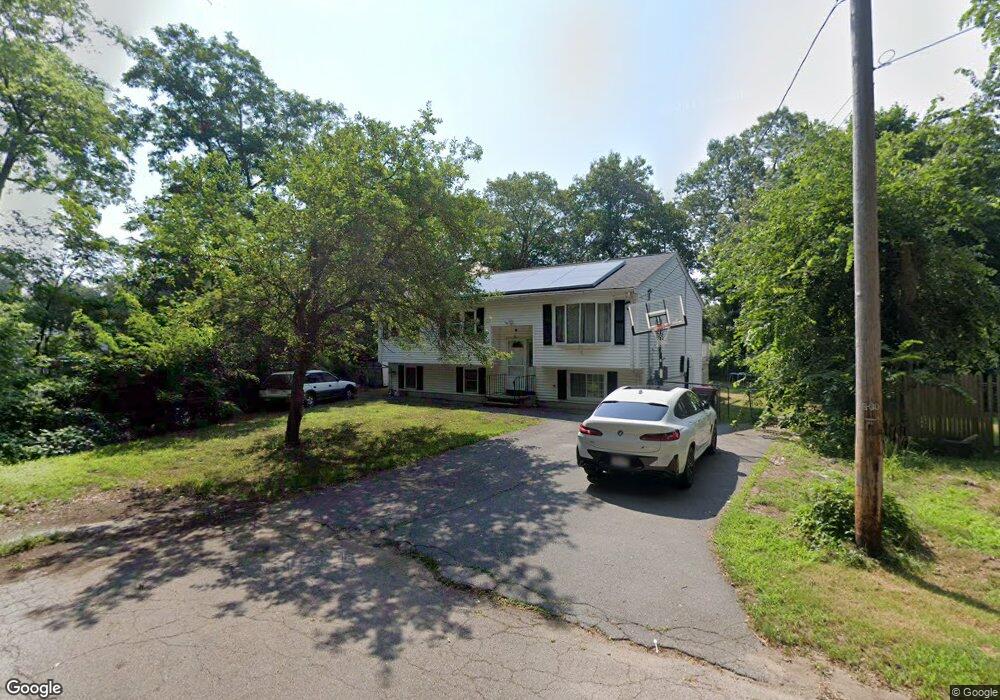
41 Whitman St Brockton, MA 02302
Estimated Value: $531,204 - $653,000
4
Beds
2
Baths
1,080
Sq Ft
$530/Sq Ft
Est. Value
About This Home
This home is located at 41 Whitman St, Brockton, MA 02302 and is currently estimated at $572,301, approximately $529 per square foot. 41 Whitman St is a home located in Plymouth County with nearby schools including Brookfield Elementary School, Mary E. Baker Elementary School, and Downey Elementary School.
Ownership History
Date
Name
Owned For
Owner Type
Purchase Details
Closed on
Jun 27, 2005
Sold by
Desrosiers Ermene and Desrosiers Rony
Bought by
Kinyua Joseph N
Current Estimated Value
Home Financials for this Owner
Home Financials are based on the most recent Mortgage that was taken out on this home.
Original Mortgage
$240,000
Outstanding Balance
$124,977
Interest Rate
5.82%
Mortgage Type
Purchase Money Mortgage
Estimated Equity
$447,324
Purchase Details
Closed on
Jan 31, 2000
Sold by
Antunes Alves Domingo and Antunes Alves Maria A
Bought by
Desrosiers Rony and Desrosiers Ermene
Purchase Details
Closed on
Oct 26, 1995
Sold by
State St B & T Co Tr
Bought by
Alves Domingo C and Alves Maria Aa
Purchase Details
Closed on
Dec 13, 1994
Sold by
Camilien Marie S and Camilien Joseph C
Bought by
Tr State St B & T Co
Create a Home Valuation Report for This Property
The Home Valuation Report is an in-depth analysis detailing your home's value as well as a comparison with similar homes in the area
Purchase History
| Date | Buyer | Sale Price | Title Company |
|---|---|---|---|
| Kinyua Joseph N | $300,000 | -- | |
| Desrosiers Rony | $150,000 | -- | |
| Alves Domingo C | $84,000 | -- | |
| Tr State St B & T Co | $73,500 | -- |
Source: Public Records
Mortgage History
| Date | Status | Borrower | Loan Amount |
|---|---|---|---|
| Open | Tr State St B & T Co | $66,750 | |
| Open | Tr State St B & T Co | $240,000 |
Source: Public Records
Tax History
| Year | Tax Paid | Tax Assessment Tax Assessment Total Assessment is a certain percentage of the fair market value that is determined by local assessors to be the total taxable value of land and additions on the property. | Land | Improvement |
|---|---|---|---|---|
| 2025 | $6,011 | $496,400 | $140,300 | $356,100 |
| 2024 | $5,899 | $490,800 | $140,300 | $350,500 |
| 2023 | $5,440 | $419,100 | $105,700 | $313,400 |
| 2022 | $4,929 | $352,800 | $96,100 | $256,700 |
| 2021 | $4,753 | $327,800 | $80,100 | $247,700 |
| 2020 | $4,545 | $300,000 | $74,700 | $225,300 |
| 2019 | $4,443 | $285,900 | $72,800 | $213,100 |
| 2018 | $4,090 | $254,700 | $72,800 | $181,900 |
| 2017 | $3,854 | $239,400 | $72,800 | $166,600 |
| 2016 | $4,106 | $236,500 | $70,700 | $165,800 |
| 2015 | $3,835 | $211,300 | $70,700 | $140,600 |
| 2014 | $3,746 | $206,600 | $70,700 | $135,900 |
Source: Public Records
Map
Nearby Homes
- 51 Sterling Rd
- 383 Quincy St
- 34 Guild Rd
- 11 Russell Rd
- 2 Dundee St
- 43 Pinehurst Ave
- 135 Guild Rd
- 58 Budd Ave
- 27 Austin Ct Unit Lot 6
- 88 Pinehurst Ave
- 18 Massasoit Ave
- 104 Crestfield Dr
- 126 Bates Rd
- 72 Crestfield Terrace
- 82 Debbie Rd Unit Lot 18
- 35 Errol Rd
- 76 Short St
- 25 Courtfield Dr
- 89 Kingman St
- 28 Gerald Ave
Your Personal Tour Guide
Ask me questions while you tour the home.