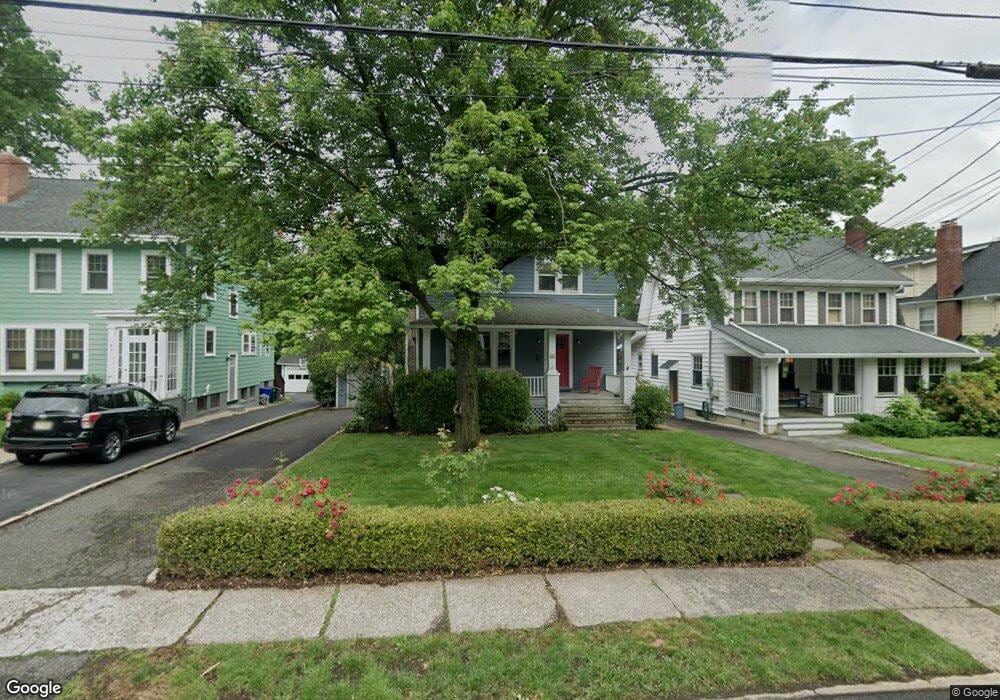
41 Yale St Maplewood, NJ 07040
Estimated Value: $995,841 - $1,070,000
--
Bed
--
Bath
1,482
Sq Ft
$703/Sq Ft
Est. Value
About This Home
This home is located at 41 Yale St, Maplewood, NJ 07040 and is currently estimated at $1,041,460, approximately $702 per square foot. 41 Yale St is a home located in Essex County with nearby schools including Tuscan Elementary School, Maplewood Middle School, and Columbia Senior High School.
Ownership History
Date
Name
Owned For
Owner Type
Purchase Details
Closed on
Jul 29, 2010
Sold by
Benivegna Marybeth R and Gerlich Maria V
Bought by
Brophy John and Brophy Clare
Current Estimated Value
Home Financials for this Owner
Home Financials are based on the most recent Mortgage that was taken out on this home.
Original Mortgage
$339,500
Outstanding Balance
$226,589
Interest Rate
4.73%
Mortgage Type
New Conventional
Estimated Equity
$814,871
Purchase Details
Closed on
Jul 31, 2002
Sold by
George Edward
Bought by
Benivegna Marybeth
Home Financials for this Owner
Home Financials are based on the most recent Mortgage that was taken out on this home.
Original Mortgage
$235,000
Interest Rate
6.58%
Purchase Details
Closed on
Oct 22, 1993
Sold by
Jackson David
Bought by
George Edward and George Elizabeth
Home Financials for this Owner
Home Financials are based on the most recent Mortgage that was taken out on this home.
Original Mortgage
$145,000
Interest Rate
6.79%
Create a Home Valuation Report for This Property
The Home Valuation Report is an in-depth analysis detailing your home's value as well as a comparison with similar homes in the area
Home Values in the Area
Average Home Value in this Area
Purchase History
| Date | Buyer | Sale Price | Title Company |
|---|---|---|---|
| Brophy John | $485,000 | Nrt Title Agency Llc | |
| Benivegna Marybeth | $345,000 | -- | |
| George Edward | $162,000 | -- |
Source: Public Records
Mortgage History
| Date | Status | Borrower | Loan Amount |
|---|---|---|---|
| Open | Brophy John | $339,500 | |
| Previous Owner | Benivegna Marybeth | $235,000 | |
| Previous Owner | George Edward | $145,000 |
Source: Public Records
Tax History Compared to Growth
Tax History
| Year | Tax Paid | Tax Assessment Tax Assessment Total Assessment is a certain percentage of the fair market value that is determined by local assessors to be the total taxable value of land and additions on the property. | Land | Improvement |
|---|---|---|---|---|
| 2025 | $18,055 | $826,100 | $402,000 | $424,100 |
| 2024 | $18,055 | $826,100 | $402,000 | $424,100 |
| 2022 | $17,605 | $499,300 | $325,000 | $174,300 |
| 2021 | $17,071 | $499,300 | $325,000 | $174,300 |
| 2020 | $16,587 | $499,300 | $325,000 | $174,300 |
| 2019 | $16,107 | $499,300 | $325,000 | $174,300 |
| 2018 | $15,693 | $499,300 | $325,000 | $174,300 |
| 2017 | $15,224 | $499,300 | $325,000 | $174,300 |
| 2016 | $14,379 | $390,200 | $252,500 | $137,700 |
| 2015 | $14,047 | $390,200 | $252,500 | $137,700 |
| 2014 | $13,751 | $390,200 | $252,500 | $137,700 |
Source: Public Records
Map
Nearby Homes
- 60 Bowdoin St
- 44 Oberlin St
- 14 Rutgers St
- 26 Colgate Rd
- 72 Concord Ave
- 56 Broadview Ave
- 61 Concord Ave
- 28 Overlook Terrace
- 27 Tuscan St
- 188 Burnett Ave
- 140 Oakview Ave
- 688 Valley St
- 289 Indiana St
- 287 Ohio St
- 11 Oakview Ave
- 297 Oswald Place
- 257 Hilton Ave
- 274 Indiana St
- 74 Burnett Ave Unit 2
- 14 Melman Terrace