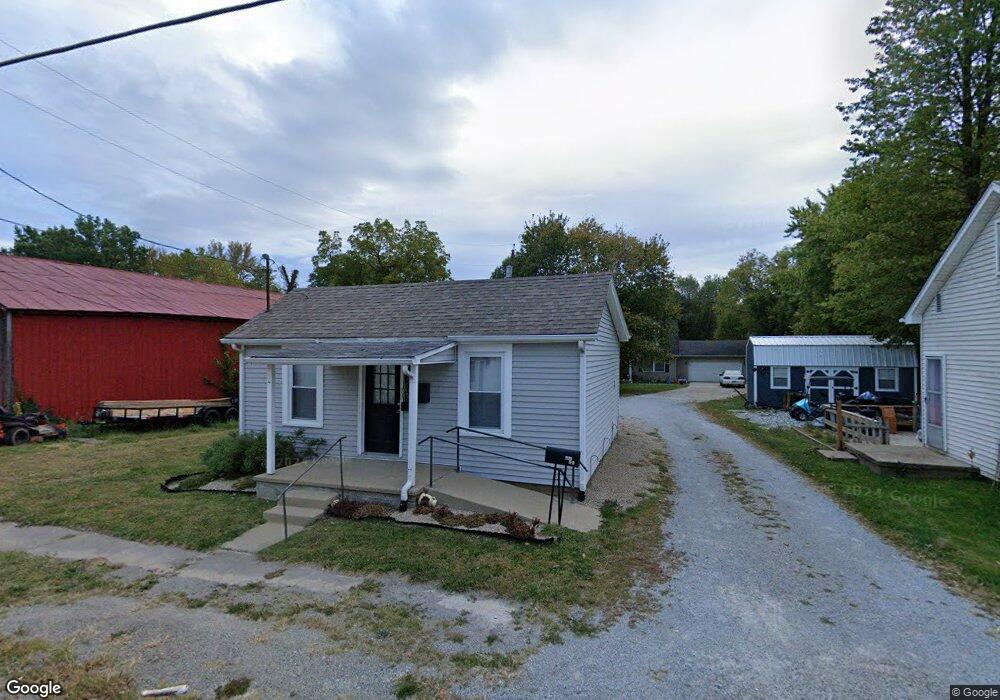
410 1/2 N Elm St Georgetown, OH 45121
Estimated Value: $234,000 - $257,024
3
Beds
3
Baths
1,658
Sq Ft
$148/Sq Ft
Est. Value
About This Home
This home is located at 410 1/2 N Elm St, Georgetown, OH 45121 and is currently estimated at $245,506, approximately $148 per square foot. 410 1/2 N Elm St is a home located in Brown County with nearby schools including Georgetown Elementary School and Georgetown Jr/Sr High School.
Ownership History
Date
Name
Owned For
Owner Type
Purchase Details
Closed on
Nov 15, 2013
Sold by
Secretary Of Hud
Bought by
Warner Josette
Current Estimated Value
Home Financials for this Owner
Home Financials are based on the most recent Mortgage that was taken out on this home.
Original Mortgage
$75,525
Outstanding Balance
$56,479
Interest Rate
4.3%
Mortgage Type
New Conventional
Estimated Equity
$189,027
Purchase Details
Closed on
Jun 28, 2013
Sold by
Thompson Derek and Thompson Melissa
Bought by
Midfirst Bank
Purchase Details
Closed on
Jun 25, 2013
Sold by
Midfirst Bank
Bought by
Secretary Of Hud
Purchase Details
Closed on
Aug 13, 2001
Sold by
Lightner William W
Bought by
Thompson Derek and Thompson Melissa
Home Financials for this Owner
Home Financials are based on the most recent Mortgage that was taken out on this home.
Original Mortgage
$128,682
Interest Rate
7.15%
Mortgage Type
FHA
Create a Home Valuation Report for This Property
The Home Valuation Report is an in-depth analysis detailing your home's value as well as a comparison with similar homes in the area
Home Values in the Area
Average Home Value in this Area
Purchase History
| Date | Buyer | Sale Price | Title Company |
|---|---|---|---|
| Warner Josette | $82,501 | None Available | |
| Midfirst Bank | $158,483 | None Available | |
| Secretary Of Hud | -- | None Available | |
| Thompson Derek | $128,682 | -- |
Source: Public Records
Mortgage History
| Date | Status | Borrower | Loan Amount |
|---|---|---|---|
| Open | Warner Josette | $75,525 | |
| Previous Owner | Thompson Derek | $128,682 |
Source: Public Records
Tax History Compared to Growth
Tax History
| Year | Tax Paid | Tax Assessment Tax Assessment Total Assessment is a certain percentage of the fair market value that is determined by local assessors to be the total taxable value of land and additions on the property. | Land | Improvement |
|---|---|---|---|---|
| 2024 | $2,455 | $69,300 | $6,920 | $62,380 |
| 2023 | $2,455 | $52,170 | $5,820 | $46,350 |
| 2022 | $2,012 | $52,170 | $5,820 | $46,350 |
| 2021 | $1,994 | $52,170 | $5,820 | $46,350 |
| 2020 | $1,764 | $43,480 | $4,850 | $38,630 |
| 2019 | $1,752 | $43,480 | $4,850 | $38,630 |
| 2018 | $1,739 | $43,480 | $4,850 | $38,630 |
| 2017 | $1,291 | $38,310 | $5,340 | $32,970 |
| 2016 | $1,291 | $38,310 | $5,340 | $32,970 |
| 2015 | $1,307 | $38,310 | $5,340 | $32,970 |
| 2014 | $1,345 | $37,820 | $4,850 | $32,970 |
| 2013 | $1,341 | $37,820 | $4,850 | $32,970 |
Source: Public Records
Map
Nearby Homes
- 60 New St
- 406 E North St
- 403 Elmwood Ct
- 401 Elmwood Ct
- 104 Elm St
- 331 Spring Grove Dr
- 405 N Main St
- 508 Mount Orab Pike
- 666 E State St
- 505 S Water St
- 427 Kenwood Ave
- 402 S Pleasant St
- 102 Bill Dee Dr
- 306 W 2nd St
- 708 E State St
- 874 Mount Orab Pike
- 418 Home St
- 25 Douglas Ln
- 0 Douglas Ln Unit 1641744
- 155 Free Soil Rd