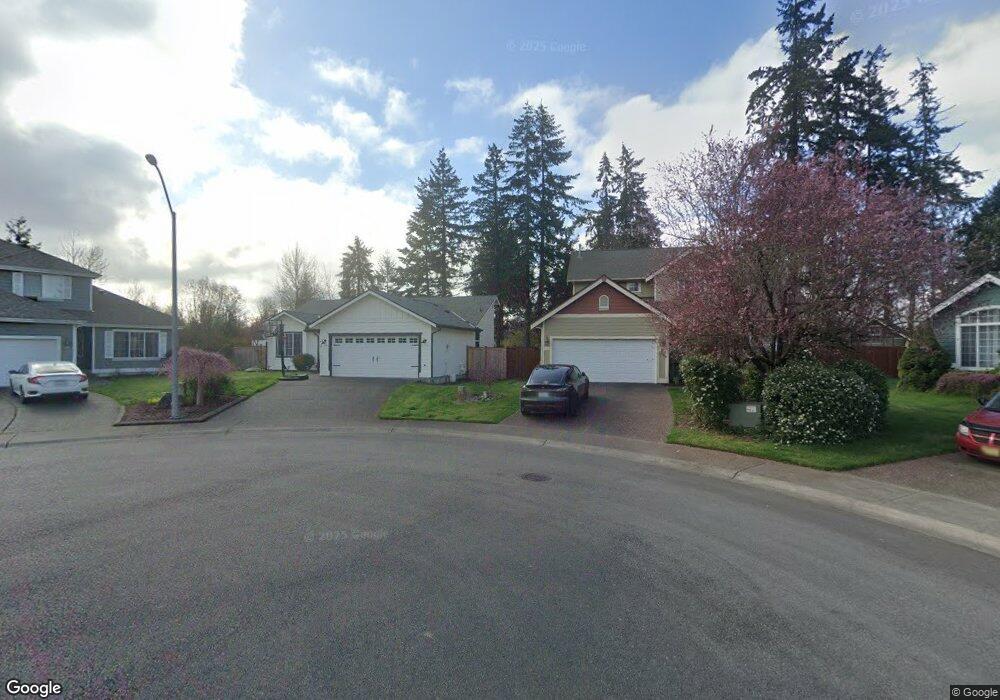
410 26th Avenue Place Milton, WA 98354
Estimated Value: $527,000 - $586,000
3
Beds
2
Baths
1,255
Sq Ft
$440/Sq Ft
Est. Value
About This Home
This home is located at 410 26th Avenue Place, Milton, WA 98354 and is currently estimated at $552,397, approximately $440 per square foot. 410 26th Avenue Place is a home located in Pierce County with nearby schools including Discovery Primary School, Hedden Elementary School, and Surprise Lake Middle School.
Ownership History
Date
Name
Owned For
Owner Type
Purchase Details
Closed on
Jan 31, 2014
Sold by
Rutter Michael D and Rutter Linda M
Bought by
Rutter Tiffany
Current Estimated Value
Home Financials for this Owner
Home Financials are based on the most recent Mortgage that was taken out on this home.
Original Mortgage
$213,750
Outstanding Balance
$162,216
Interest Rate
4.45%
Mortgage Type
New Conventional
Estimated Equity
$390,181
Purchase Details
Closed on
Oct 16, 2006
Sold by
Grigsby Laura L and Grigsby Thomas J
Bought by
Rutter Michael D and Rutter Linda M
Purchase Details
Closed on
Sep 27, 1996
Sold by
Schneider Homes Inc
Bought by
Horlander Laura L
Home Financials for this Owner
Home Financials are based on the most recent Mortgage that was taken out on this home.
Original Mortgage
$93,700
Interest Rate
7.87%
Create a Home Valuation Report for This Property
The Home Valuation Report is an in-depth analysis detailing your home's value as well as a comparison with similar homes in the area
Home Values in the Area
Average Home Value in this Area
Purchase History
| Date | Buyer | Sale Price | Title Company |
|---|---|---|---|
| Rutter Tiffany | $224,719 | Nextitle | |
| Rutter Michael D | $285,000 | Rainier Title | |
| Horlander Laura L | $168,925 | Chicago Title |
Source: Public Records
Mortgage History
| Date | Status | Borrower | Loan Amount |
|---|---|---|---|
| Open | Rutter Tiffany | $213,750 | |
| Previous Owner | Horlander Laura L | $93,700 |
Source: Public Records
Tax History Compared to Growth
Tax History
| Year | Tax Paid | Tax Assessment Tax Assessment Total Assessment is a certain percentage of the fair market value that is determined by local assessors to be the total taxable value of land and additions on the property. | Land | Improvement |
|---|---|---|---|---|
| 2025 | $5,019 | $506,500 | $267,000 | $239,500 |
| 2024 | $5,019 | $485,600 | $207,900 | $277,700 |
| 2023 | $5,019 | $501,700 | $231,600 | $270,100 |
| 2022 | $4,828 | $502,500 | $257,400 | $245,100 |
| 2021 | $4,730 | $357,900 | $169,400 | $188,500 |
| 2019 | $3,826 | $325,400 | $139,000 | $186,400 |
| 2018 | $3,376 | $300,200 | $124,600 | $175,600 |
| 2017 | $2,831 | $265,000 | $94,200 | $170,800 |
| 2016 | $2,440 | $202,700 | $71,500 | $131,200 |
| 2014 | $2,171 | $190,200 | $64,400 | $125,800 |
| 2013 | $2,171 | $170,400 | $55,400 | $115,000 |
Source: Public Records
Map
Nearby Homes
- 2745 Comet St Unit 2745
- 2313 Milton Way Unit G
- 2500 Alder St Unit 317
- 0 XXX Emerald St E
- 2311 Milton Way Unit F
- 508 19th Ave
- 1801 Emerald St
- 927 Meridian Ave E
- Janice Plan at Surprise Lake - Suprise Lake
- Coronado Plan at Surprise Lake - Suprise Lake
- Foster Plan at Surprise Lake - Suprise Lake
- Donovan Plan at Surprise Lake - Suprise Lake
- 38000 31st Ct S
- 38020 34th Ct S
- 2803 S 375th Place Unit Lot10
- 2621 S 376th Place
- 1604 Juniper St
- 1916 S 379th St
- 37639 30th Place S
- 1515 Milton Way
- 408 26th Avenue Place
- 411 26th Avenue Place
- 406 26th Avenue Place
- 409 26th Avenue Place
- LOT 7 27th Ave
- Lot 21 27th Ave
- 0 27th Ave Unit NWM1568684
- 0 27th Ave
- 503 27th Ave
- 407 26th Avenue Place
- 405 26th Avenue Place
- 2749 Diamond Loop Unit D3
- 2749 Diamond Loop Unit D2
- 2749 Diamond Loop Unit D1
- 2749 Diamond Loop Unit C
- 398 26th Ave
- 2411 Emerald Dr
- 2407 Emerald Dr
- 399 26th Ave