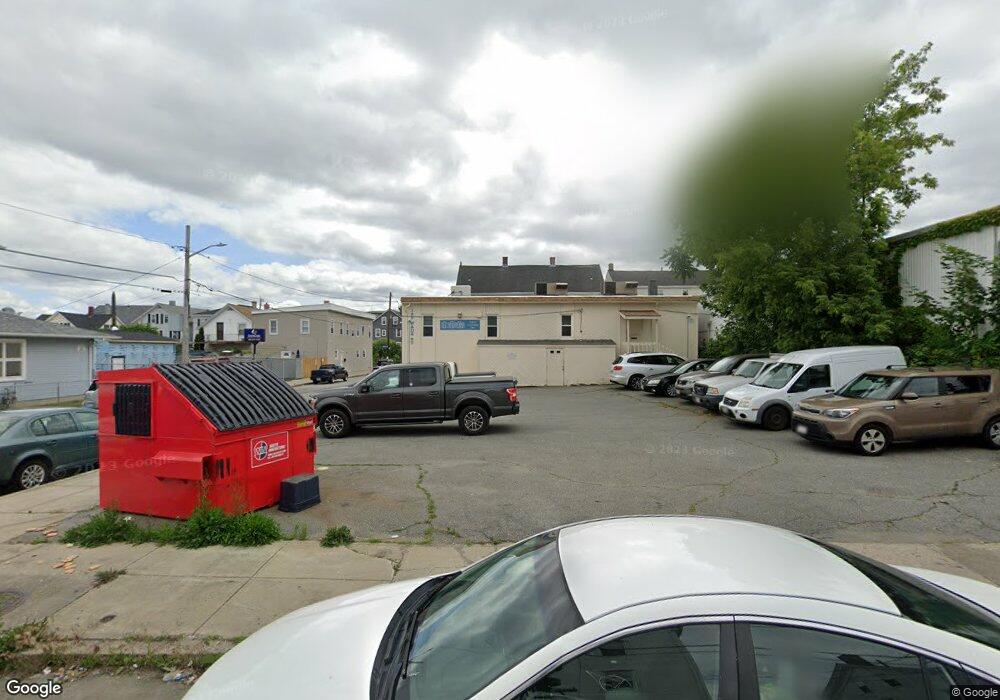
410 3rd St Fall River, MA 02721
Corky Row NeighborhoodEstimated Value: $991,124
3
Beds
1
Bath
5,000
Sq Ft
$198/Sq Ft
Est. Value
About This Home
This home is located at 410 3rd St, Fall River, MA 02721 and is currently estimated at $991,124, approximately $198 per square foot. 410 3rd St is a home located in Bristol County with nearby schools including Henry Lord Community School and B M C Durfee High School.
Ownership History
Date
Name
Owned For
Owner Type
Purchase Details
Closed on
Apr 13, 2010
Sold by
Kalco Realty Co Llc
Bought by
Fall River Hsng Prop L
Current Estimated Value
Home Financials for this Owner
Home Financials are based on the most recent Mortgage that was taken out on this home.
Original Mortgage
$348,000
Outstanding Balance
$233,154
Interest Rate
5.12%
Mortgage Type
Commercial
Estimated Equity
$757,970
Purchase Details
Closed on
Jul 7, 2008
Sold by
Kalil Rt and Kalil Charles D
Bought by
Khoury Charlene J and Kalil Charles D
Purchase Details
Closed on
Mar 24, 2008
Sold by
Kalil Rt and Kalil Charles D
Bought by
Khoury Charlene J and Kalil Charles D
Purchase Details
Closed on
Jun 30, 1998
Sold by
Kalil Rt and Kalil Kalil S S
Bought by
Palumbo Prop Inc
Home Financials for this Owner
Home Financials are based on the most recent Mortgage that was taken out on this home.
Original Mortgage
$250,000
Interest Rate
7.09%
Mortgage Type
Commercial
Create a Home Valuation Report for This Property
The Home Valuation Report is an in-depth analysis detailing your home's value as well as a comparison with similar homes in the area
Home Values in the Area
Average Home Value in this Area
Purchase History
| Date | Buyer | Sale Price | Title Company |
|---|---|---|---|
| Fall River Hsng Prop L | $435,000 | -- | |
| Khoury Charlene J | -- | -- | |
| Khoury Charlene J | -- | -- | |
| Palumbo Prop Inc | $410,000 | -- |
Source: Public Records
Mortgage History
| Date | Status | Borrower | Loan Amount |
|---|---|---|---|
| Open | Fall River Hsng Prop L | $348,000 | |
| Previous Owner | Palumbo Prop Inc | $250,000 |
Source: Public Records
Tax History
| Year | Tax Paid | Tax Assessment Tax Assessment Total Assessment is a certain percentage of the fair market value that is determined by local assessors to be the total taxable value of land and additions on the property. | Land | Improvement |
|---|---|---|---|---|
| 2025 | $13,445 | $564,200 | $154,300 | $409,900 |
| 2024 | $12,925 | $539,900 | $147,000 | $392,900 |
| 2023 | $10,752 | $417,400 | $133,400 | $284,000 |
| 2022 | $11,282 | $417,400 | $133,400 | $284,000 |
| 2021 | $10,876 | $366,200 | $131,500 | $234,700 |
| 2020 | $11,007 | $359,600 | $137,600 | $222,000 |
| 2019 | $11,114 | $354,400 | $137,600 | $216,800 |
| 2018 | $10,901 | $350,300 | $137,600 | $212,700 |
| 2017 | $10,733 | $350,300 | $137,600 | $212,700 |
| 2016 | $10,204 | $350,300 | $137,600 | $212,700 |
| 2015 | $10,029 | $356,400 | $137,600 | $218,800 |
| 2014 | $9,509 | $356,400 | $137,600 | $218,800 |
Source: Public Records
Map
Nearby Homes
- 180 Morgan St
- 424 Third St Unit 1N
- 424 Third St Unit 3N
- 424 Third St Unit 1S
- 307 4th St Unit 1
- 172 Morgan St Unit 2S
- 436 Third St Unit 1N
- 384 3rd St
- 384 Third St
- 291 4th St
- 119 Wade St Unit 3B
- 119 Wade St Unit 2B
- 119 Wade St Unit 3rd flr
- 119 Wade St Unit 3A
- 119 Wade St Unit 2C
- 119 Wade St
- 125 Wade St Unit 3C
- 125 Wade St Unit 2
- 125 Wade St Unit 2C
- 125 Wade St Unit 1C
Your Personal Tour Guide
Ask me questions while you tour the home.