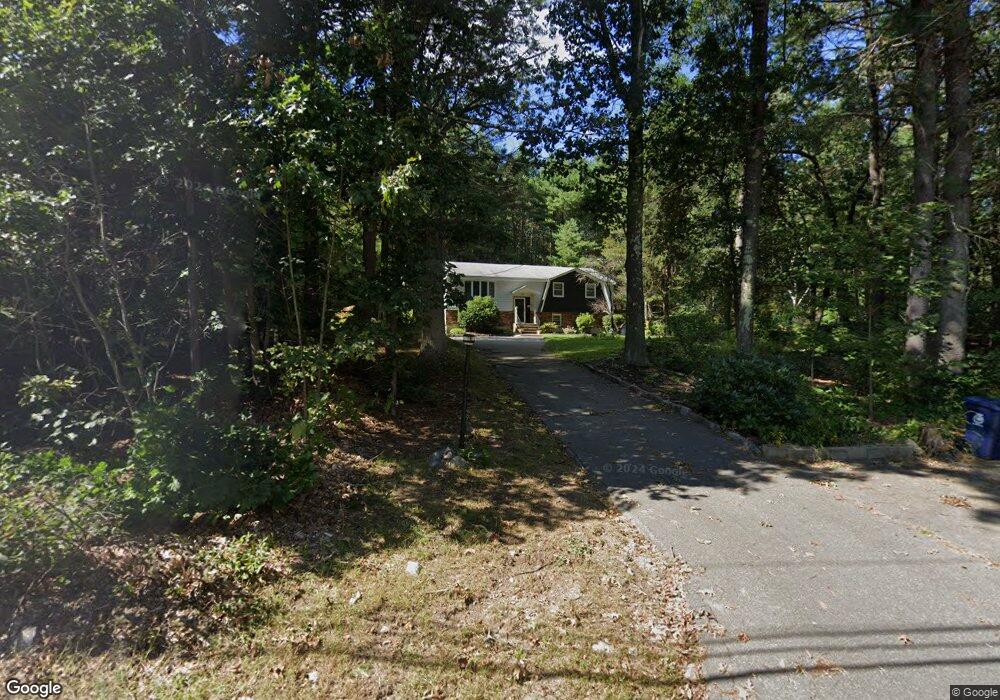
410 Andover St Wilmington, MA 01887
Estimated Value: $645,000 - $921,000
3
Beds
3
Baths
1,190
Sq Ft
$660/Sq Ft
Est. Value
About This Home
This home is located at 410 Andover St, Wilmington, MA 01887 and is currently estimated at $785,921, approximately $660 per square foot. 410 Andover St is a home located in Middlesex County with nearby schools including Wilmington Middle School, Wilmington High School, and Andover School of Montessori.
Ownership History
Date
Name
Owned For
Owner Type
Purchase Details
Closed on
Oct 14, 2023
Sold by
Pudvelis Mary B and Pudvelis Sara J
Bought by
Pudvelis Andover St T and Pudvelis
Current Estimated Value
Purchase Details
Closed on
Sep 10, 2020
Sold by
Pudvelis Mark D and Pudvelis Mary B
Bought by
Pudvelis Mary B and Pudvelis Sara J
Home Financials for this Owner
Home Financials are based on the most recent Mortgage that was taken out on this home.
Original Mortgage
$250,000
Interest Rate
2.9%
Mortgage Type
New Conventional
Purchase Details
Closed on
Jan 11, 1993
Sold by
Clapp Irving W and Clapp Ann C
Bought by
Pudvelis Mark D and Hamel Mary Beth
Home Financials for this Owner
Home Financials are based on the most recent Mortgage that was taken out on this home.
Original Mortgage
$147,150
Interest Rate
8.24%
Mortgage Type
Purchase Money Mortgage
Create a Home Valuation Report for This Property
The Home Valuation Report is an in-depth analysis detailing your home's value as well as a comparison with similar homes in the area
Home Values in the Area
Average Home Value in this Area
Purchase History
| Date | Buyer | Sale Price | Title Company |
|---|---|---|---|
| Pudvelis Andover St T | -- | None Available | |
| Pudvelis Mary B | -- | None Available | |
| Pudvelis Mark D | $163,500 | -- |
Source: Public Records
Mortgage History
| Date | Status | Borrower | Loan Amount |
|---|---|---|---|
| Previous Owner | Pudvelis Mary B | $250,000 | |
| Previous Owner | Pudvelis Mark D | $25,000 | |
| Previous Owner | Pudvelis Mark D | $133,000 | |
| Previous Owner | Pudvelis Mark D | $135,600 | |
| Previous Owner | Pudvelis Mark D | $147,150 |
Source: Public Records
Tax History Compared to Growth
Tax History
| Year | Tax Paid | Tax Assessment Tax Assessment Total Assessment is a certain percentage of the fair market value that is determined by local assessors to be the total taxable value of land and additions on the property. | Land | Improvement |
|---|---|---|---|---|
| 2025 | $8,370 | $731,000 | $330,600 | $400,400 |
| 2024 | $8,292 | $725,500 | $330,600 | $394,900 |
| 2023 | $8,022 | $671,900 | $300,600 | $371,300 |
| 2022 | $7,663 | $588,100 | $251,400 | $336,700 |
| 2021 | $7,540 | $544,800 | $229,200 | $315,600 |
| 2020 | $7,622 | $561,300 | $229,200 | $332,100 |
| 2019 | $7,022 | $510,700 | $218,400 | $292,300 |
| 2018 | $6,585 | $457,000 | $208,200 | $248,800 |
| 2017 | $6,410 | $443,600 | $208,200 | $235,400 |
| 2016 | $6,156 | $420,800 | $198,300 | $222,500 |
| 2015 | $5,862 | $407,900 | $198,300 | $209,600 |
| 2014 | $5,519 | $387,600 | $189,100 | $198,500 |
Source: Public Records
Map
Nearby Homes
- 9 Flash Rd
- 2 Clover Cir
- 12 Parkview Terrace
- 24 Enfield Dr
- 18 Boston Rd
- 30A Colonial Dr Unit 6
- 40 Colonial Dr Unit 8
- 1 Colonial Dr Unit C1-6
- 1 Colonial Dr Unit B1-8
- 11 Gould Rd
- 20 Colonial Dr Unit 3
- 11 Cogswell Rd
- 10 Hillside Rd
- 17 Linda Rd
- 18 Burroughs Rd
- 21 Rocky Hill Rd
- 40 Ballardvale Rd
- 300 Martins Landing Unit 107
- 12 Lockwood Rd
- 260 Martins Landing Unit 508
- 406 Andover St
- 415 Andover St
- 420 Andover St
- 405 Andover St
- 427 Andover St
- 419 Andover St
- 417 Andover St
- 404 Andover St
- 421 Andover St
- 421 Andover St
- 403 Andover St
- 6 My Way Cir
- 5 My Way Cir
- 402 Andover St Unit B
- 402 Andover St
- 402 Andover St Unit 1
- 402b Andover St
- 31 Hensey Way Unit 31
- 9A Fiorenza Dr
- 9 Fiorenza Dr