Estimated Value: $171,776 - $201,000
2
Beds
1
Bath
748
Sq Ft
$253/Sq Ft
Est. Value
About This Home
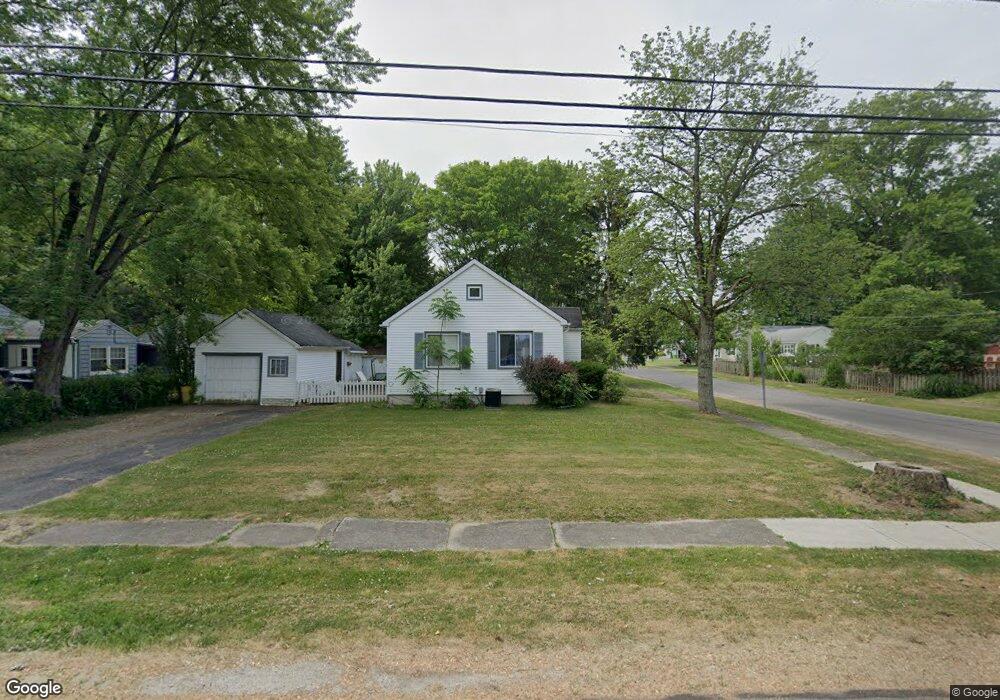
This home is located at 410 Austin St, Berea, OH 44017 and is currently estimated at $189,194, approximately $252 per square foot. 410 Austin St is a home located in Cuyahoga County with nearby schools including Grindstone Elementary School, Berea-Midpark Middle School, and Berea-Midpark High School.
Ownership History
Date
Name
Owned For
Owner Type
Purchase Details
Closed on
Dec 4, 1998
Sold by
Dorenbos Randy and Dorenbos Kristy E
Bought by
Hocevar Russell J and Hocevar Theresa Bowden
Current Estimated Value
Home Financials for this Owner
Home Financials are based on the most recent Mortgage that was taken out on this home.
Original Mortgage
$69,000
Outstanding Balance
$15,700
Interest Rate
6.8%
Estimated Equity
$173,494
Purchase Details
Closed on
Mar 6, 1996
Sold by
Canterbury Robert F
Bought by
Dorenbos Randy and Dorenbos Kristy E
Home Financials for this Owner
Home Financials are based on the most recent Mortgage that was taken out on this home.
Original Mortgage
$58,000
Interest Rate
7.05%
Mortgage Type
New Conventional
Purchase Details
Closed on
May 4, 1990
Sold by
Pereida Marjorie B
Bought by
Canterbury Robert F
Purchase Details
Closed on
Oct 19, 1982
Sold by
Kitsock Julia
Bought by
Pereida Marjorie B
Purchase Details
Closed on
Jan 1, 1975
Bought by
Kitsock Julia
Create a Home Valuation Report for This Property
The Home Valuation Report is an in-depth analysis detailing your home's value as well as a comparison with similar homes in the area
Home Values in the Area
Average Home Value in this Area
Purchase History
| Date | Buyer | Sale Price | Title Company |
|---|---|---|---|
| Hocevar Russell J | $92,000 | -- | |
| Dorenbos Randy | $88,000 | -- | |
| Canterbury Robert F | $56,500 | -- | |
| Pereida Marjorie B | -- | -- | |
| Kitsock Julia | -- | -- |
Source: Public Records
Mortgage History
| Date | Status | Borrower | Loan Amount |
|---|---|---|---|
| Open | Hocevar Russell J | $69,000 | |
| Previous Owner | Dorenbos Randy | $58,000 |
Source: Public Records
Tax History Compared to Growth
Tax History
| Year | Tax Paid | Tax Assessment Tax Assessment Total Assessment is a certain percentage of the fair market value that is determined by local assessors to be the total taxable value of land and additions on the property. | Land | Improvement |
|---|---|---|---|---|
| 2024 | $2,891 | $49,910 | $11,515 | $38,395 |
| 2023 | $3,062 | $39,660 | $9,660 | $30,000 |
| 2022 | $2,722 | $39,660 | $9,660 | $30,000 |
| 2021 | $2,699 | $39,660 | $9,660 | $30,000 |
| 2020 | $3,111 | $33,600 | $8,190 | $25,410 |
| 2019 | $3,105 | $96,000 | $23,400 | $72,600 |
| 2018 | $2,812 | $33,600 | $8,190 | $25,410 |
| 2017 | $3,183 | $30,740 | $7,460 | $23,280 |
| 2016 | $2,441 | $30,740 | $7,460 | $23,280 |
| 2015 | $3,651 | $30,740 | $7,460 | $23,280 |
| 2014 | $3,651 | $32,030 | $7,770 | $24,260 |
Source: Public Records
Map
Nearby Homes
- 19419 Fowles Rd
- 159 Eastland Rd
- 147 Adams St
- 7400 Engle Rd
- 7344 Engle Rd
- 0 E Bagley Rd Unit 5111166
- 41 Riverside Dr
- 8080 Oxford Dr
- 325 Robin Dr
- 47 Prospect St
- 202 4th Ave
- 190 Lee Rd
- 7254 Craigmere Dr
- 7381 Grant Blvd
- 23 Hamilton St
- 7221 Craigmere Dr
- 74 Aaron St
- 135 W Bagley Rd
- 18676 N Winding Oak Dr
- 18156 Broxton Dr