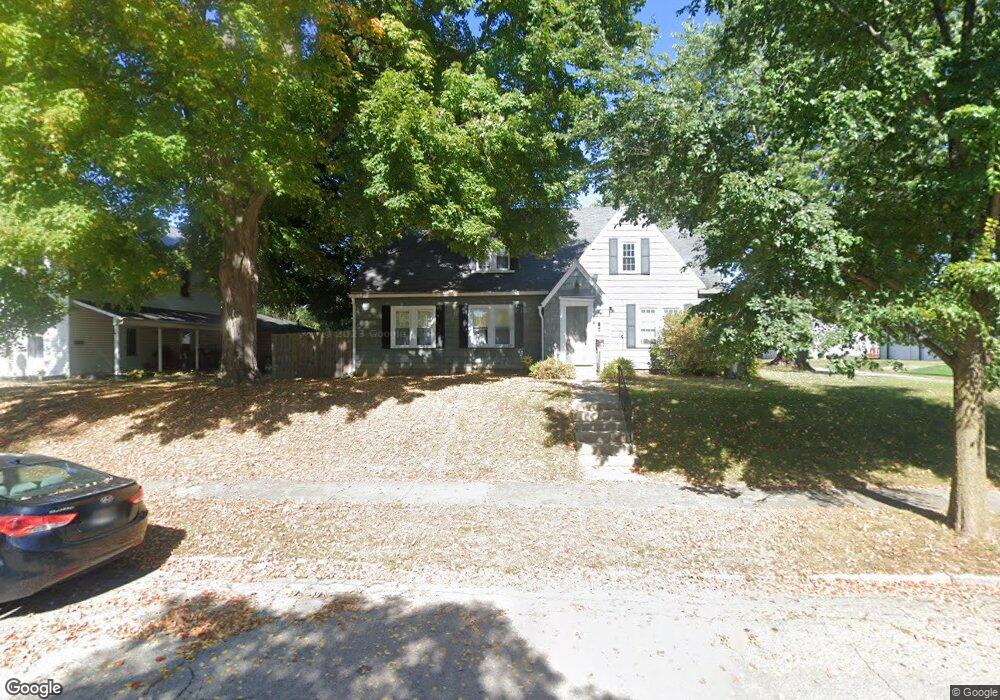
410 Boyce St Urbana, OH 43078
Estimated Value: $151,000 - $191,000
2
Beds
1
Bath
1,456
Sq Ft
$119/Sq Ft
Est. Value
About This Home
This home is located at 410 Boyce St, Urbana, OH 43078 and is currently estimated at $173,076, approximately $118 per square foot. 410 Boyce St is a home located in Champaign County with nearby schools including Urbana Elementary School, Urbana High School, and Urbana Community School.
Ownership History
Date
Name
Owned For
Owner Type
Purchase Details
Closed on
Dec 28, 2021
Sold by
Levings Wesley W and Levings Ann E
Bought by
Martin Arthur
Current Estimated Value
Home Financials for this Owner
Home Financials are based on the most recent Mortgage that was taken out on this home.
Original Mortgage
$108,007
Outstanding Balance
$99,464
Interest Rate
3.05%
Mortgage Type
FHA
Estimated Equity
$73,613
Purchase Details
Closed on
Oct 15, 2004
Sold by
Beneficial Ohio Inc
Bought by
Levings Wesley W and Levings Ann E
Home Financials for this Owner
Home Financials are based on the most recent Mortgage that was taken out on this home.
Original Mortgage
$49,500
Interest Rate
5.93%
Mortgage Type
New Conventional
Purchase Details
Closed on
Oct 31, 2003
Sold by
Milliron Marjorie I and Carpenter Mitchell L
Bought by
Beneficial Ohio Inc
Create a Home Valuation Report for This Property
The Home Valuation Report is an in-depth analysis detailing your home's value as well as a comparison with similar homes in the area
Home Values in the Area
Average Home Value in this Area
Purchase History
| Date | Buyer | Sale Price | Title Company |
|---|---|---|---|
| Martin Arthur | $110,000 | None Listed On Document | |
| Levings Wesley W | $55,000 | -- | |
| Beneficial Ohio Inc | -- | -- |
Source: Public Records
Mortgage History
| Date | Status | Borrower | Loan Amount |
|---|---|---|---|
| Open | Martin Arthur | $108,007 | |
| Previous Owner | Levings Wesley W | $49,500 |
Source: Public Records
Tax History Compared to Growth
Tax History
| Year | Tax Paid | Tax Assessment Tax Assessment Total Assessment is a certain percentage of the fair market value that is determined by local assessors to be the total taxable value of land and additions on the property. | Land | Improvement |
|---|---|---|---|---|
| 2024 | $1,453 | $34,560 | $5,320 | $29,240 |
| 2023 | $1,453 | $34,560 | $5,320 | $29,240 |
| 2022 | $1,482 | $34,560 | $5,320 | $29,240 |
| 2021 | $1,296 | $26,770 | $4,250 | $22,520 |
| 2020 | $1,296 | $26,770 | $4,250 | $22,520 |
| 2019 | $1,280 | $26,770 | $4,250 | $22,520 |
| 2018 | $1,087 | $21,720 | $3,660 | $18,060 |
| 2017 | $1,080 | $21,720 | $3,660 | $18,060 |
| 2016 | $1,083 | $21,720 | $3,660 | $18,060 |
| 2015 | $1,072 | $20,860 | $3,660 | $17,200 |
| 2014 | $1,073 | $20,860 | $3,660 | $17,200 |
| 2013 | $917 | $20,860 | $3,660 | $17,200 |
Source: Public Records
Map
Nearby Homes