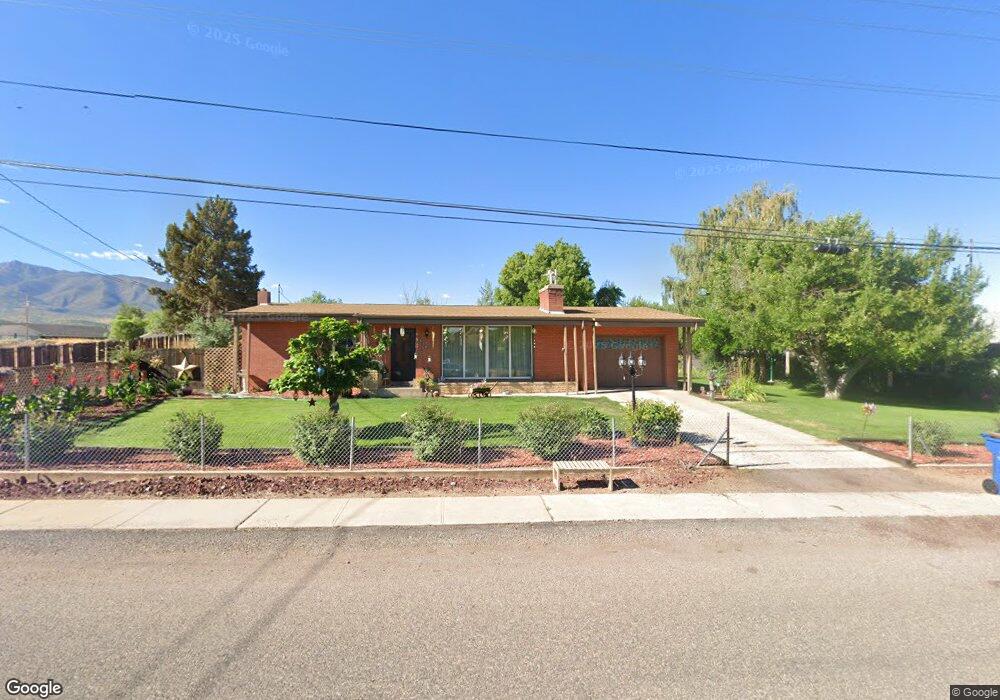
410 Canyon Rd Fillmore, UT 84631
Estimated Value: $353,000 - $641,000
--
Bed
--
Bath
--
Sq Ft
0.78
Acres
About This Home
This home is located at 410 Canyon Rd, Fillmore, UT 84631 and is currently estimated at $472,914. 410 Canyon Rd is a home.
Ownership History
Date
Name
Owned For
Owner Type
Purchase Details
Closed on
Nov 15, 2021
Sold by
Dastrup Zachary J
Bought by
Dastrup Zachary J and Dastrup Harmony Erica
Current Estimated Value
Purchase Details
Closed on
May 6, 2010
Sold by
Woodhouse Janette and Dastrup Coleen G
Bought by
Dastrup Zachery John
Home Financials for this Owner
Home Financials are based on the most recent Mortgage that was taken out on this home.
Original Mortgage
$108,061
Outstanding Balance
$72,439
Interest Rate
5.21%
Mortgage Type
New Conventional
Estimated Equity
$400,475
Create a Home Valuation Report for This Property
The Home Valuation Report is an in-depth analysis detailing your home's value as well as a comparison with similar homes in the area
Home Values in the Area
Average Home Value in this Area
Purchase History
| Date | Buyer | Sale Price | Title Company |
|---|---|---|---|
| Dastrup Zachary J | -- | First American Title | |
| Dastrup Zachary J | -- | First American Title | |
| Dastrup Zachery John | -- | -- |
Source: Public Records
Mortgage History
| Date | Status | Borrower | Loan Amount |
|---|---|---|---|
| Open | Dastrup Zachery John | $108,061 |
Source: Public Records
Tax History Compared to Growth
Tax History
| Year | Tax Paid | Tax Assessment Tax Assessment Total Assessment is a certain percentage of the fair market value that is determined by local assessors to be the total taxable value of land and additions on the property. | Land | Improvement |
|---|---|---|---|---|
| 2025 | $1,736 | $218,057 | $37,957 | $180,100 |
| 2024 | $1,736 | $195,493 | $29,055 | $166,438 |
| 2023 | $2,072 | $195,493 | $29,055 | $166,438 |
| 2022 | $1,733 | $155,564 | $26,414 | $129,150 |
| 2021 | $1,519 | $130,927 | $17,152 | $113,775 |
| 2020 | $1,407 | $121,988 | $15,593 | $106,395 |
| 2019 | $1,198 | $104,191 | $15,593 | $88,598 |
| 2018 | $1,142 | $101,693 | $15,593 | $86,100 |
| 2017 | $1,018 | $86,149 | $15,593 | $70,556 |
| 2016 | $973 | $86,149 | $15,593 | $70,556 |
| 2015 | $974 | $86,149 | $15,593 | $70,556 |
| 2014 | -- | $86,149 | $15,593 | $70,556 |
| 2013 | -- | $86,149 | $15,593 | $70,556 |
Source: Public Records
Map
Nearby Homes
- 430 E Canyon Rd
- 310 S 600 E
- 220 S 200 E
- 405 E 500 St S
- 157 E 500 South St
- 155 E 500 St S
- 40 S 100 Rd E
- 690 E 500 S
- 750 800 South Fillmore
- 825 800 South Fillmore
- 800 800 South Fillmore
- 760 E 700 St S
- 190 W 400 St S
- 165 N 100 W
- 295 N 100 West St
- 225 W 200 St N
- 390 N 100 W
- 380 N 200 St W
- 310 S 500 West Rd
- 335 W 400 North St