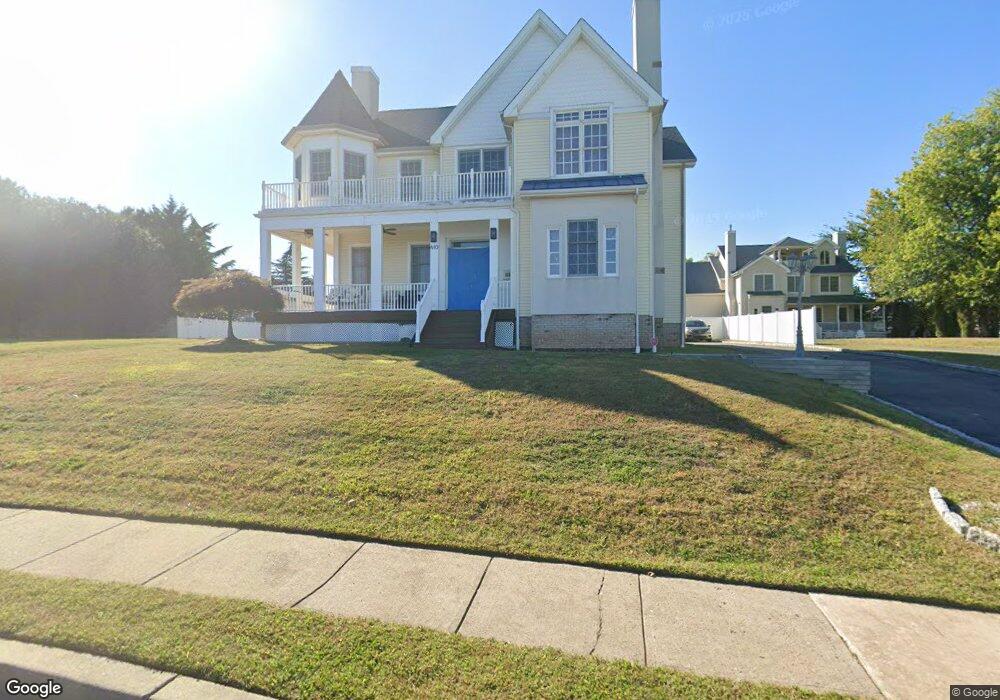
410 Cliff Rd Sewaren, NJ 07077
Estimated Value: $684,000 - $1,008,000
4
Beds
3
Baths
3,681
Sq Ft
$209/Sq Ft
Est. Value
About This Home
This home is located at 410 Cliff Rd, Sewaren, NJ 07077 and is currently estimated at $769,523, approximately $209 per square foot. 410 Cliff Rd is a home located in Middlesex County with nearby schools including Matthew Jago Elementary School, Avenel Middle School, and Woodbridge High School.
Ownership History
Date
Name
Owned For
Owner Type
Purchase Details
Closed on
Mar 9, 2018
Sold by
White Michael
Bought by
Yadav Mukesh
Current Estimated Value
Purchase Details
Closed on
Jun 10, 2005
Sold by
Cliff Road Assocs
Bought by
White Michael
Home Financials for this Owner
Home Financials are based on the most recent Mortgage that was taken out on this home.
Original Mortgage
$400,000
Interest Rate
5.73%
Mortgage Type
Unknown
Create a Home Valuation Report for This Property
The Home Valuation Report is an in-depth analysis detailing your home's value as well as a comparison with similar homes in the area
Home Values in the Area
Average Home Value in this Area
Purchase History
| Date | Buyer | Sale Price | Title Company |
|---|---|---|---|
| Yadav Mukesh | $450,000 | River Edge Title Agency | |
| White Michael | $575,000 | -- |
Source: Public Records
Mortgage History
| Date | Status | Borrower | Loan Amount |
|---|---|---|---|
| Previous Owner | White Michael | $400,000 | |
| Previous Owner | White Michael | $500,000 |
Source: Public Records
Tax History
| Year | Tax Paid | Tax Assessment Tax Assessment Total Assessment is a certain percentage of the fair market value that is determined by local assessors to be the total taxable value of land and additions on the property. | Land | Improvement |
|---|---|---|---|---|
| 2025 | $22,130 | $163,500 | $24,200 | $139,300 |
| 2024 | $21,582 | $163,500 | $24,200 | $139,300 |
Source: Public Records
Map
Nearby Homes
- 391 East Ave
- 59 E New St
- 121 Woodbridge Ave
- 36 Vernon St
- 140 S Robert St
- 193 Old Rd
- 28 Debra Place
- 15 Rector Ave
- 15 Rector Ave Unit 2
- 135 Crampton Ave
- 271 Woodbridge Ave
- 24 4th Ave
- 60 Crampton Ave
- 74 Albert St
- 29 Claire Ave
- 0 Winant Place
- 46 Melbourne Ct
- 78 Spring St
- 584 Garden Ave
- 68 Port Reading Ave
Your Personal Tour Guide
Ask me questions while you tour the home.