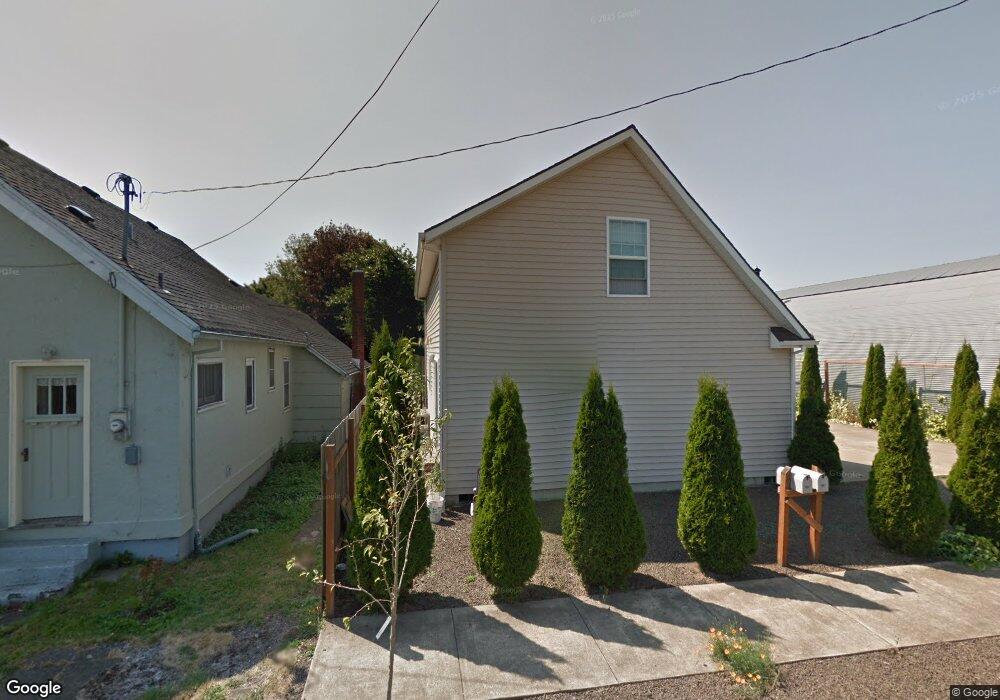
410 Delmonte Ave Unit B Tillamook, OR 97141
Estimated Value: $313,000 - $341,000
3
Beds
3
Baths
1,350
Sq Ft
$240/Sq Ft
Est. Value
About This Home
This home is located at 410 Delmonte Ave Unit B, Tillamook, OR 97141 and is currently estimated at $324,604, approximately $240 per square foot. 410 Delmonte Ave Unit B is a home located in Tillamook County with nearby schools including Tillamook High School, Little Clipper Preschool, and Tillamook Adventist School.
Ownership History
Date
Name
Owned For
Owner Type
Purchase Details
Closed on
Jul 8, 2019
Sold by
Vansant Donovan S
Bought by
Speed William R and Speed Anita F
Current Estimated Value
Home Financials for this Owner
Home Financials are based on the most recent Mortgage that was taken out on this home.
Original Mortgage
$212,800
Outstanding Balance
$186,341
Interest Rate
3.9%
Mortgage Type
New Conventional
Estimated Equity
$138,263
Purchase Details
Closed on
Jun 16, 2017
Sold by
Cole Stewart D and Price Cole Patricia A
Bought by
Vansant Donovan S
Home Financials for this Owner
Home Financials are based on the most recent Mortgage that was taken out on this home.
Original Mortgage
$176,262
Interest Rate
4.02%
Mortgage Type
New Conventional
Purchase Details
Closed on
Jul 28, 2005
Sold by
Sumerlin Willie M and Sumerlin Nathan W
Bought by
Cole Stewart D and Price Cole Patricia A
Home Financials for this Owner
Home Financials are based on the most recent Mortgage that was taken out on this home.
Original Mortgage
$104,000
Interest Rate
5.56%
Mortgage Type
Fannie Mae Freddie Mac
Create a Home Valuation Report for This Property
The Home Valuation Report is an in-depth analysis detailing your home's value as well as a comparison with similar homes in the area
Home Values in the Area
Average Home Value in this Area
Purchase History
| Date | Buyer | Sale Price | Title Company |
|---|---|---|---|
| Speed William R | $224,000 | Ticor Title Company Of Or | |
| Vansant Donovan S | $174,500 | Ticor Title Company Of Or | |
| Cole Stewart D | $130,000 | Ticor Title Ins Co |
Source: Public Records
Mortgage History
| Date | Status | Borrower | Loan Amount |
|---|---|---|---|
| Open | Speed William R | $212,800 | |
| Previous Owner | Vansant Donovan S | $176,262 | |
| Previous Owner | Cole Stewart D | $104,000 |
Source: Public Records
Tax History Compared to Growth
Tax History
| Year | Tax Paid | Tax Assessment Tax Assessment Total Assessment is a certain percentage of the fair market value that is determined by local assessors to be the total taxable value of land and additions on the property. | Land | Improvement |
|---|---|---|---|---|
| 2024 | $1,982 | $168,180 | $30,630 | $137,550 |
| 2023 | $1,964 | $163,290 | $29,740 | $133,550 |
| 2022 | $1,897 | $158,540 | $28,870 | $129,670 |
| 2021 | $1,841 | $153,930 | $28,030 | $125,900 |
| 2020 | $1,790 | $149,450 | $27,210 | $122,240 |
| 2019 | $1,745 | $145,100 | $26,420 | $118,680 |
| 2018 | $1,700 | $140,880 | $25,650 | $115,230 |
| 2017 | $1,657 | $136,780 | $24,900 | $111,880 |
| 2016 | $1,595 | $132,800 | $24,170 | $108,630 |
| 2015 | $1,562 | $128,940 | $23,460 | $105,480 |
| 2014 | $1,536 | $125,190 | $22,780 | $102,410 |
| 2013 | -- | $121,550 | $22,110 | $99,440 |
Source: Public Records
Map
Nearby Homes
- 616 Park Ave
- 2410 3rd St
- 2506 1st St
- 2418 1st St
- Parcel 1 Wilson River Hwy
- Parcel 2 Wilson River Hwy
- 500 etc. Wilson River Hwy
- 00101 Wilson River Hwy
- 00201 Wilson River Hwy
- TL #00101 Wilson River Hwy
- TL# 02100 Wilson River Hwy
- 2417 10th St
- 2105 9th St
- TL#02600 12th St
- 0 12th St Unit 2405
- 3413 Maple Ln
- 903 Evergreen Dr
- 1806 8th St
- 02600 12th St
- 1706 5th St
- 410 Del Monte Ave Unit A
- 410 Delmonte Ave Unit A
- 410 Delmonte Ave
- 410 Del Monte Ave
- 410 Delmonte Ave
- 410 Del Monte Ave B
- 2616 5th St
- 2602 5th St
- 2605 4th St
- 405 Park Ave
- 2704 5th St
- 2609 5th St
- 2605 5th St
- 409 Delmonte 1weuoumkbh21
- 409 Delmonte Ave
- 409 Del Monte Ave
- 2615 5th St
- 2615 5th St Unit 2615 5th Street
- 2526 5th St
- 407 Delmonte Ave