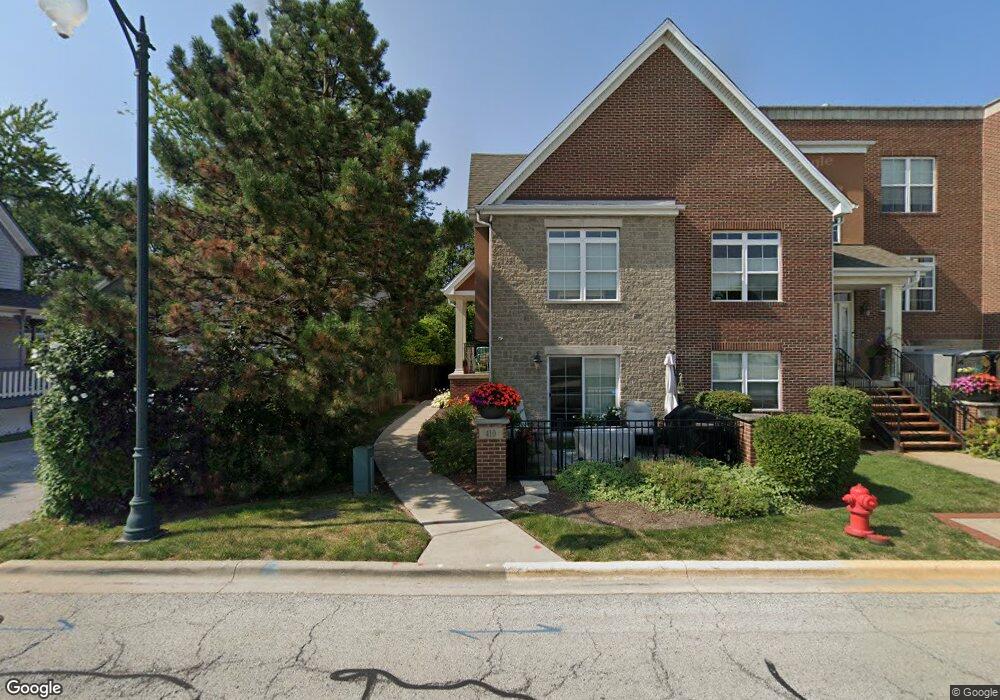
410 E 160th Place Unit A South Holland, IL 60473
South River-Cook County NeighborhoodEstimated Value: $230,000 - $299,000
2
Beds
3
Baths
1,978
Sq Ft
$132/Sq Ft
Est. Value
About This Home
This home is located at 410 E 160th Place Unit A, South Holland, IL 60473 and is currently estimated at $261,647, approximately $132 per square foot. 410 E 160th Place Unit A is a home located in Cook County with nearby schools including Taft School, Eisenhower School, and Coolidge Middle School.
Ownership History
Date
Name
Owned For
Owner Type
Purchase Details
Closed on
May 27, 2022
Sold by
Liberty Debra E
Bought by
Chicago Title Land Trust Company
Current Estimated Value
Purchase Details
Closed on
Sep 30, 2020
Sold by
Edgar Ralph and Ralph Edgar Declaration Of Tru
Bought by
Liberty Debra E
Purchase Details
Closed on
May 1, 2017
Sold by
Hale Mark Sheldon
Bought by
Edgar Ralph and Ralph Edgar Declaration Of Trust
Purchase Details
Closed on
Jun 1, 2010
Sold by
Edgar Ralph
Bought by
Hale Doris
Home Financials for this Owner
Home Financials are based on the most recent Mortgage that was taken out on this home.
Original Mortgage
$251,000
Interest Rate
4.74%
Mortgage Type
Seller Take Back
Purchase Details
Closed on
May 21, 2008
Sold by
Covenant Development One Llc
Bought by
Ralph Edgar Declaration Of Trust
Home Financials for this Owner
Home Financials are based on the most recent Mortgage that was taken out on this home.
Original Mortgage
$208,000
Interest Rate
6.25%
Create a Home Valuation Report for This Property
The Home Valuation Report is an in-depth analysis detailing your home's value as well as a comparison with similar homes in the area
Home Values in the Area
Average Home Value in this Area
Purchase History
| Date | Buyer | Sale Price | Title Company |
|---|---|---|---|
| Chicago Title Land Trust Company | -- | London Ted | |
| Liberty Debra E | $185,000 | Chicago Title | |
| Edgar Ralph | -- | Attorney | |
| Hale Doris | $260,000 | Cti | |
| Ralph Edgar Declaration Of Trust | $208,000 | Cti |
Source: Public Records
Mortgage History
| Date | Status | Borrower | Loan Amount |
|---|---|---|---|
| Previous Owner | Hale Doris | $251,000 | |
| Previous Owner | Ralph Edgar Declaration Of Trust | $208,000 |
Source: Public Records
Tax History Compared to Growth
Tax History
| Year | Tax Paid | Tax Assessment Tax Assessment Total Assessment is a certain percentage of the fair market value that is determined by local assessors to be the total taxable value of land and additions on the property. | Land | Improvement |
|---|---|---|---|---|
| 2024 | $3,391 | $19,000 | $869 | $18,131 |
| 2023 | $4,492 | $19,000 | $869 | $18,131 |
| 2022 | $4,492 | $17,719 | $745 | $16,974 |
| 2021 | $6,950 | $17,718 | $745 | $16,973 |
| 2020 | $6,776 | $17,718 | $745 | $16,973 |
| 2019 | $8,759 | $15,000 | $662 | $14,338 |
| 2018 | $8,555 | $15,000 | $662 | $14,338 |
| 2017 | $4,944 | $15,000 | $662 | $14,338 |
| 2016 | $8,488 | $15,650 | $621 | $15,029 |
| 2015 | $5,500 | $15,650 | $621 | $15,029 |
| 2014 | $5,268 | $18,378 | $621 | $17,757 |
| 2013 | $5,085 | $14,991 | $621 | $14,370 |
Source: Public Records
Map
Nearby Homes
- 519 E 161st St
- 509 E 161st Place
- 521 E 161st Place
- 609 E 160th Place
- 16083 School St
- 618 E 159th Place
- 634 E 161st St
- 16211 Joyce Cir
- 112 E 160th Place
- 16037 Evans Ave
- 644 E 162nd St
- 15760 Church Dr
- 15750 Woodlawn West Ave
- 428 E 156th Place
- 664 E 163rd St
- 45 E 159th St
- 60 E 162nd St
- 16046 Prairie Ave
- 16007 Cottage Grove Ave
- 615 E 156th Place
- 410 E 160th Place
- 418 E 160th Place
- 16010 Veterans Park Dr
- 414 E 160th Place
- 414 E 160th Place Unit 2
- 422 E 160th Place
- 422 E 160th Place Unit 4
- 16020 Veterans Park Dr Unit 16020
- 16010 E Park Place Dr
- 16000 E Park Place Dr
- 16000 Veterans Park Dr Unit 7
- 16020 Veterans Park Dr Unit 16020
- 16020 Veterans Park Dr Unit 5
- 16020 Veterans Park Dr
- 16003 S Park Ave
- 16021 S Park Ave
- 15959 S Park Ave
- 445 E 160th Place
- 445 E 160th Place
- 16020 S Park Ave