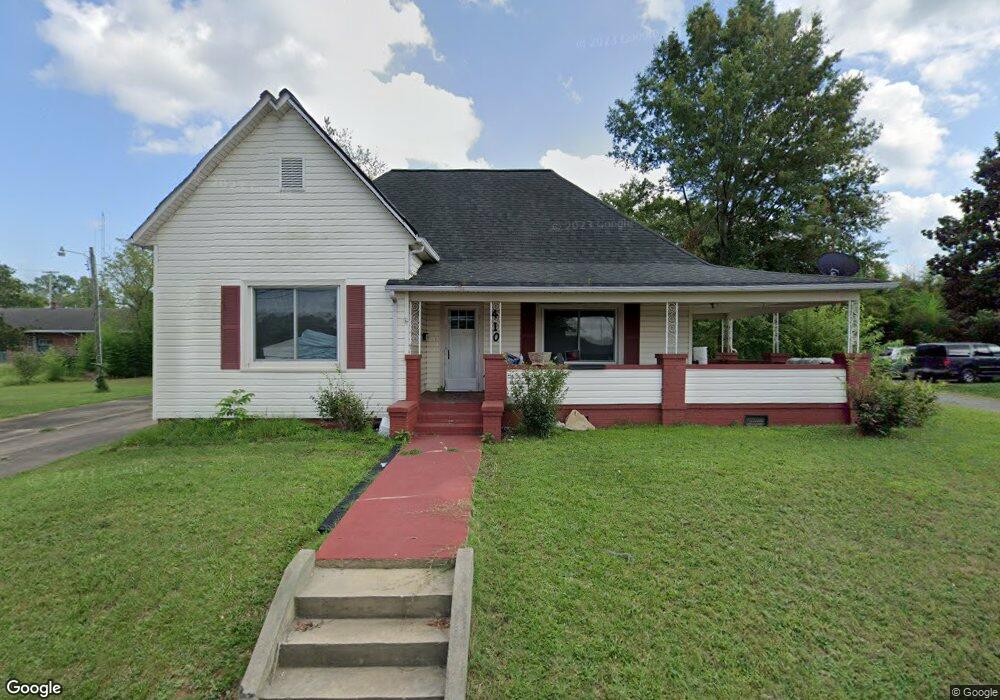
410 E 1st St Cherryville, NC 28021
Estimated Value: $189,618 - $232,000
3
Beds
1
Bath
1,920
Sq Ft
$109/Sq Ft
Est. Value
About This Home
This home is located at 410 E 1st St, Cherryville, NC 28021 and is currently estimated at $208,405, approximately $108 per square foot. 410 E 1st St is a home located in Gaston County with nearby schools including Cherryville Elementary School, William B. Beam Intermediate School, and John Chavis Middle School.
Ownership History
Date
Name
Owned For
Owner Type
Purchase Details
Closed on
Jan 31, 2013
Sold by
Champey Gregory Alan and Champey Gregory Allen
Bought by
Champey Gregory Alan
Current Estimated Value
Home Financials for this Owner
Home Financials are based on the most recent Mortgage that was taken out on this home.
Original Mortgage
$82,860
Outstanding Balance
$59,140
Interest Rate
3.87%
Mortgage Type
FHA
Estimated Equity
$149,265
Purchase Details
Closed on
Oct 28, 2005
Sold by
Bridges Collette Ann
Bought by
Champey Gregory Allen
Home Financials for this Owner
Home Financials are based on the most recent Mortgage that was taken out on this home.
Original Mortgage
$16,300
Interest Rate
5.71%
Mortgage Type
Stand Alone Second
Create a Home Valuation Report for This Property
The Home Valuation Report is an in-depth analysis detailing your home's value as well as a comparison with similar homes in the area
Home Values in the Area
Average Home Value in this Area
Purchase History
| Date | Buyer | Sale Price | Title Company |
|---|---|---|---|
| Champey Gregory Alan | -- | None Available | |
| Champey Gregory Allen | $82,000 | Atlantis Title Co |
Source: Public Records
Mortgage History
| Date | Status | Borrower | Loan Amount |
|---|---|---|---|
| Open | Champey Gregory Alan | $82,860 | |
| Closed | Champey Gregory Allen | $16,300 | |
| Closed | Champey Gregory Allen | $65,000 |
Source: Public Records
Tax History
| Year | Tax Paid | Tax Assessment Tax Assessment Total Assessment is a certain percentage of the fair market value that is determined by local assessors to be the total taxable value of land and additions on the property. | Land | Improvement |
|---|---|---|---|---|
| 2025 | $1,426 | $132,180 | $9,000 | $123,180 |
| 2024 | $1,426 | $132,180 | $9,000 | $123,180 |
| 2023 | $1,441 | $132,180 | $9,000 | $123,180 |
| 2022 | $1,238 | $93,100 | $8,100 | $85,000 |
| 2021 | $1,257 | $93,100 | $8,100 | $85,000 |
| 2019 | $1,210 | $93,100 | $8,100 | $85,000 |
| 2018 | $925 | $69,554 | $9,600 | $59,954 |
| 2017 | $942 | $69,554 | $9,600 | $59,954 |
| 2016 | $942 | $70,850 | $0 | $0 |
| 2014 | $959 | $72,089 | $13,500 | $58,589 |
Source: Public Records
Map
Nearby Homes
- 709 E Main St
- 117 W Main St
- 901 E Church St
- 600 Queens Rd
- 500 N Mountain St
- 210 W Church St
- 411 N Mulberry St
- 303 S Pink St
- 404 S Mulberry St
- 402 N Cherry St
- 507 N Mulberry St
- 510 N Mulberry St
- 514 N Mulberry St
- 516 N Mulberry St
- 519 S Mulberry St
- 416 N Pine St
- 422 N Pine St
- 103 W Irwin St
- 414 Spinners Dr
- 301 Jc Dellinger Rd
Your Personal Tour Guide
Ask me questions while you tour the home.