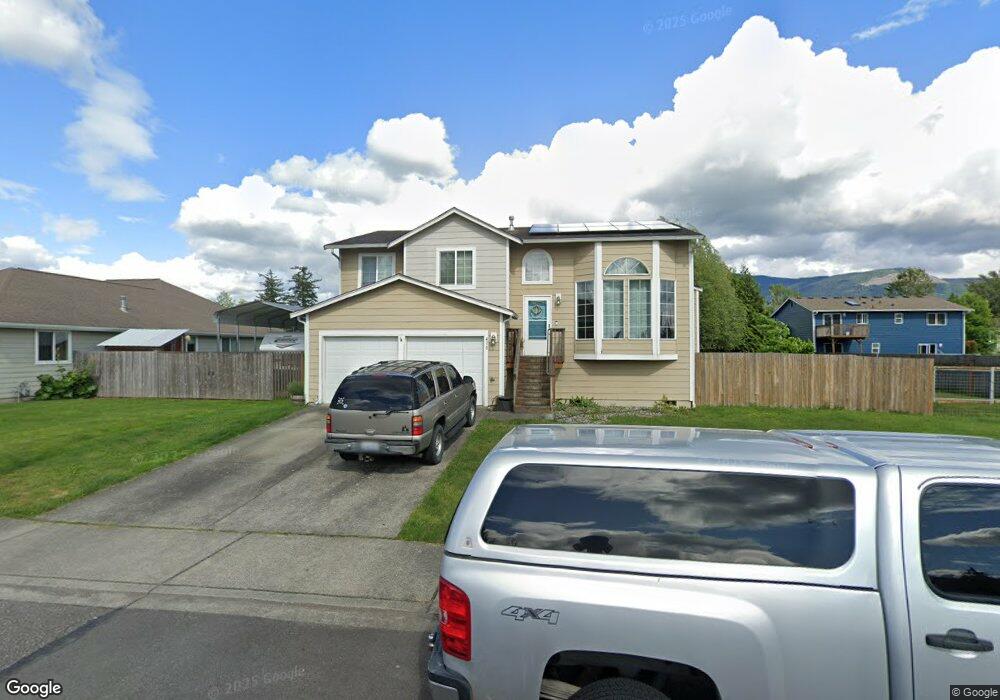
410 E 2nd St Nooksack, WA 98247
Estimated Value: $503,000 - $526,832
3
Beds
2
Baths
1,161
Sq Ft
$441/Sq Ft
Est. Value
About This Home
This home is located at 410 E 2nd St, Nooksack, WA 98247 and is currently estimated at $512,458, approximately $441 per square foot. 410 E 2nd St is a home located in Whatcom County with nearby schools including Nooksack Elementary School, Everson Elementary School, and Sumas Elementary School.
Ownership History
Date
Name
Owned For
Owner Type
Purchase Details
Closed on
Jan 21, 2021
Sold by
Holt Jason R
Bought by
Holt Candice J
Current Estimated Value
Purchase Details
Closed on
Aug 24, 2009
Sold by
Himalaya Homes Inc
Bought by
Holt Jason R and Holt Candice J
Home Financials for this Owner
Home Financials are based on the most recent Mortgage that was taken out on this home.
Original Mortgage
$196,327
Outstanding Balance
$127,810
Interest Rate
5.18%
Mortgage Type
FHA
Estimated Equity
$384,648
Purchase Details
Closed on
Mar 1, 2006
Sold by
Burch Daniel W and Burch Edee
Bought by
Himalaya Homes Inc
Home Financials for this Owner
Home Financials are based on the most recent Mortgage that was taken out on this home.
Original Mortgage
$2,633,750
Interest Rate
6.18%
Mortgage Type
Unknown
Create a Home Valuation Report for This Property
The Home Valuation Report is an in-depth analysis detailing your home's value as well as a comparison with similar homes in the area
Home Values in the Area
Average Home Value in this Area
Purchase History
| Date | Buyer | Sale Price | Title Company |
|---|---|---|---|
| Holt Candice J | -- | None Available | |
| Holt Jason R | $200,230 | Chicago Title Insurance | |
| Himalaya Homes Inc | $3,762,780 | First American Title Insuran |
Source: Public Records
Mortgage History
| Date | Status | Borrower | Loan Amount |
|---|---|---|---|
| Open | Holt Jason R | $196,327 | |
| Previous Owner | Himalaya Homes Inc | $2,633,750 |
Source: Public Records
Tax History Compared to Growth
Tax History
| Year | Tax Paid | Tax Assessment Tax Assessment Total Assessment is a certain percentage of the fair market value that is determined by local assessors to be the total taxable value of land and additions on the property. | Land | Improvement |
|---|---|---|---|---|
| 2024 | $3,947 | $450,546 | $180,000 | $270,546 |
| 2023 | $3,947 | $447,580 | $137,744 | $309,836 |
| 2022 | $3,613 | $403,233 | $124,096 | $279,137 |
| 2021 | $3,351 | $333,255 | $102,560 | $230,695 |
| 2020 | $3,213 | $270,945 | $83,384 | $187,561 |
| 2019 | $2,777 | $270,945 | $83,384 | $187,561 |
| 2018 | $3,093 | $259,949 | $80,000 | $179,949 |
| 2017 | $2,771 | $215,946 | $63,800 | $152,146 |
| 2016 | $2,650 | $199,272 | $58,850 | $140,422 |
| 2015 | $2,259 | $191,190 | $56,760 | $134,430 |
| 2014 | -- | $185,262 | $55,000 | $130,262 |
| 2013 | -- | $185,262 | $55,000 | $130,262 |
Source: Public Records
Map
Nearby Homes
- 404 W 3rd St
- 717 E 5th St
- 412 W 3rd St
- 107 S Pass Rd Unit 14
- 107 S Pass Rd Unit 23
- 308 W 3rd St
- 304 W 3rd St
- 705 E 5th St
- 409 Amareen Ct
- 109 W 2nd St
- 1204 E Georgia Ln
- 506 Amareen Ct
- 921 Whispering Meadows Ct
- 3599 Breckenridge Rd
- 201 Brentwood Dr
- 7554 Nooksack Rd
- 207 E Main St
- 108 Baker St Unit 1-4
- 205 Reeds Ln Unit 64
- 404 W 4th St