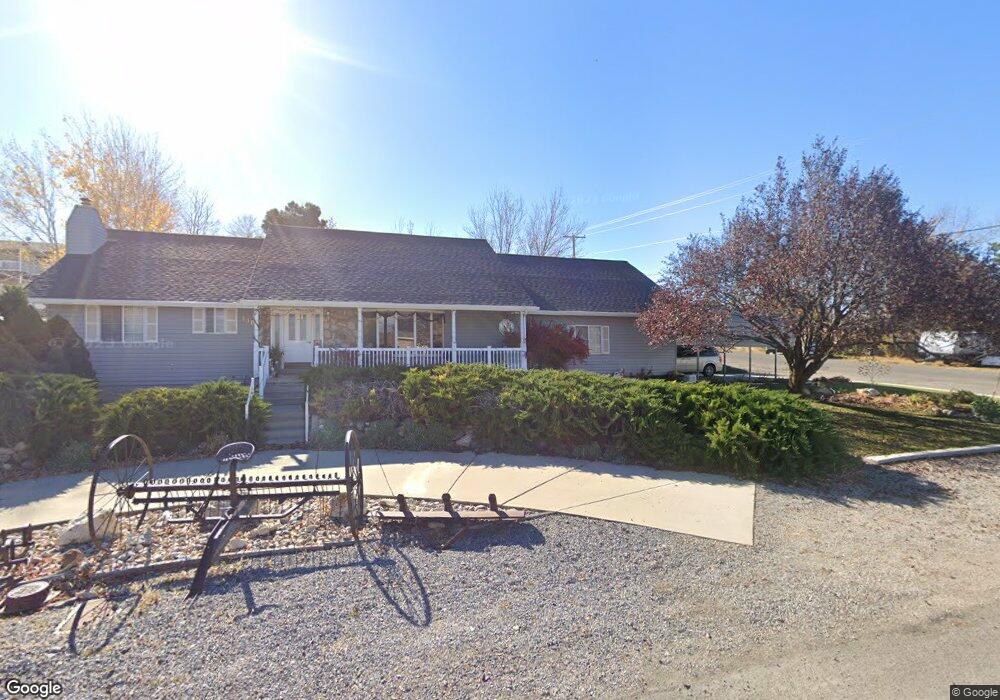
410 E 400 S Santaquin, UT 84655
Estimated Value: $534,000 - $558,538
4
Beds
3
Baths
3,687
Sq Ft
$147/Sq Ft
Est. Value
About This Home
This home is located at 410 E 400 S, Santaquin, UT 84655 and is currently estimated at $542,846, approximately $147 per square foot. 410 E 400 S is a home located in Utah County with nearby schools including Orchard Hills Elementary School, Payson Junior High School, and Mt. Nebo Middle.
Ownership History
Date
Name
Owned For
Owner Type
Purchase Details
Closed on
Dec 18, 2012
Sold by
Charlesworth Lester B
Bought by
Charlesworth Lester Bennett and Lester Bennett Charlesworth Trust
Current Estimated Value
Purchase Details
Closed on
Aug 29, 2007
Sold by
Daley Gary R
Bought by
Charlesworth Lester B
Purchase Details
Closed on
Oct 25, 2002
Sold by
Daley Gary Robert and Daley Trudy Marie
Bought by
Daley Gary R
Home Financials for this Owner
Home Financials are based on the most recent Mortgage that was taken out on this home.
Original Mortgage
$175,500
Interest Rate
5.88%
Create a Home Valuation Report for This Property
The Home Valuation Report is an in-depth analysis detailing your home's value as well as a comparison with similar homes in the area
Home Values in the Area
Average Home Value in this Area
Purchase History
| Date | Buyer | Sale Price | Title Company |
|---|---|---|---|
| Charlesworth Lester Bennett | -- | None Available | |
| Charlesworth Lester B | -- | None Available | |
| Daley Gary R | -- | Old Rebuplic Title Of Utah |
Source: Public Records
Mortgage History
| Date | Status | Borrower | Loan Amount |
|---|---|---|---|
| Previous Owner | Daley Gary R | $175,500 |
Source: Public Records
Tax History
| Year | Tax Paid | Tax Assessment Tax Assessment Total Assessment is a certain percentage of the fair market value that is determined by local assessors to be the total taxable value of land and additions on the property. | Land | Improvement |
|---|---|---|---|---|
| 2025 | $2,654 | $296,120 | -- | -- |
| 2024 | $2,654 | $264,275 | $0 | $0 |
| 2023 | $2,745 | $274,230 | $0 | $0 |
| 2022 | $2,628 | $270,765 | $0 | $0 |
| 2021 | $2,283 | $364,700 | $81,100 | $283,600 |
| 2020 | $2,192 | $339,300 | $70,500 | $268,800 |
| 2019 | $1,897 | $300,300 | $66,600 | $233,700 |
| 2018 | $1,762 | $265,900 | $62,700 | $203,200 |
| 2017 | $1,640 | $132,275 | $0 | $0 |
| 2016 | $1,565 | $123,640 | $0 | $0 |
| 2015 | $1,419 | $110,000 | $0 | $0 |
| 2014 | $1,417 | $109,560 | $0 | $0 |
Source: Public Records
Map
Nearby Homes
Your Personal Tour Guide
Ask me questions while you tour the home.