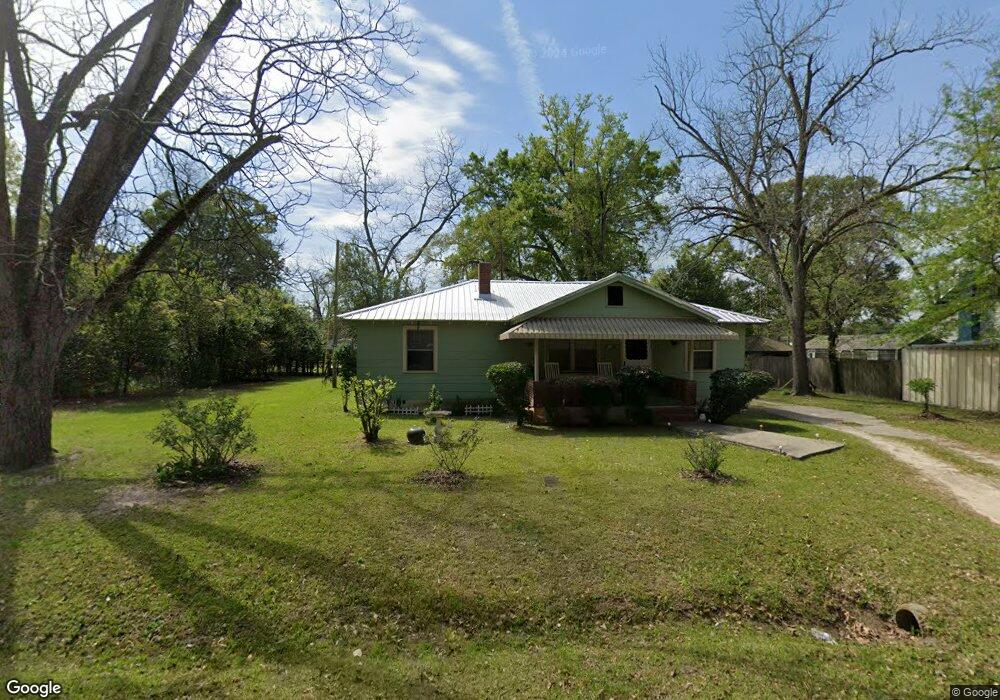
410 E 7th Ave Cordele, GA 31015
Estimated Value: $68,000 - $106,000
2
Beds
1
Bath
1,188
Sq Ft
$72/Sq Ft
Est. Value
About This Home
This home is located at 410 E 7th Ave, Cordele, GA 31015 and is currently estimated at $85,189, approximately $71 per square foot. 410 E 7th Ave is a home located in Crisp County with nearby schools including Crisp County Elementary School, Crisp County Primary School, and Crisp County Middle School.
Ownership History
Date
Name
Owned For
Owner Type
Purchase Details
Closed on
Jul 17, 2006
Sold by
Residential Funding Corp
Bought by
Mckenzie Rosie Mae
Current Estimated Value
Home Financials for this Owner
Home Financials are based on the most recent Mortgage that was taken out on this home.
Original Mortgage
$23,000
Outstanding Balance
$13,472
Interest Rate
6.6%
Mortgage Type
New Conventional
Estimated Equity
$71,717
Purchase Details
Closed on
Dec 6, 2005
Sold by
Perry Sirrabian
Bought by
Residential Funding Corp
Purchase Details
Closed on
May 30, 2003
Sold by
Perry Sirrabian A
Bought by
Perry Sirrabian A and Wilso Malanda A
Purchase Details
Closed on
Dec 30, 2002
Sold by
Bullock Larry J Etal
Bought by
Perry Sirrabian A
Purchase Details
Closed on
Sep 1, 1998
Sold by
Bullock G Rex
Bought by
Bullock Larry J Et
Purchase Details
Closed on
Dec 13, 1991
Sold by
Stephens Louise
Bought by
Bullock Larry Etal
Purchase Details
Closed on
Aug 4, 1981
Bought by
Stephens Louise
Create a Home Valuation Report for This Property
The Home Valuation Report is an in-depth analysis detailing your home's value as well as a comparison with similar homes in the area
Purchase History
| Date | Buyer | Sale Price | Title Company |
|---|---|---|---|
| Mckenzie Rosie Mae | $25,000 | -- | |
| Mckenzie Rosie Mae | $25,000 | -- | |
| Residential Funding Corp | $30,000 | -- | |
| Perry Sirrabian A | -- | -- | |
| Perry Sirrabian A | $37,000 | -- | |
| Bullock Larry J Et | -- | -- | |
| Bullock Larry Etal | -- | -- | |
| Stephens Louise | -- | -- |
Source: Public Records
Mortgage History
| Date | Status | Borrower | Loan Amount |
|---|---|---|---|
| Open | Mckenzie Rosie Mae | $23,000 | |
| Closed | Mckenzie Rosie Mae | $23,000 |
Source: Public Records
Tax History
| Year | Tax Paid | Tax Assessment Tax Assessment Total Assessment is a certain percentage of the fair market value that is determined by local assessors to be the total taxable value of land and additions on the property. | Land | Improvement |
|---|---|---|---|---|
| 2025 | $446 | $24,692 | $1,500 | $23,192 |
| 2024 | $394 | $22,519 | $1,500 | $21,019 |
| 2023 | $364 | $21,432 | $1,500 | $19,932 |
| 2022 | $120 | $20,345 | $1,500 | $18,845 |
| 2021 | $118 | $19,258 | $1,500 | $17,758 |
| 2020 | $107 | $19,258 | $1,500 | $17,758 |
| 2019 | $108 | $19,258 | $1,500 | $17,758 |
| 2018 | $398 | $9,807 | $1,800 | $8,007 |
| 2017 | $398 | $9,807 | $1,800 | $8,007 |
| 2016 | $231 | $9,807 | $1,800 | $8,007 |
| 2015 | -- | $9,807 | $1,800 | $8,007 |
| 2014 | -- | $9,807 | $1,800 | $8,007 |
| 2013 | -- | $9,806 | $1,800 | $8,006 |
Source: Public Records
Map
Nearby Homes
Your Personal Tour Guide
Ask me questions while you tour the home.