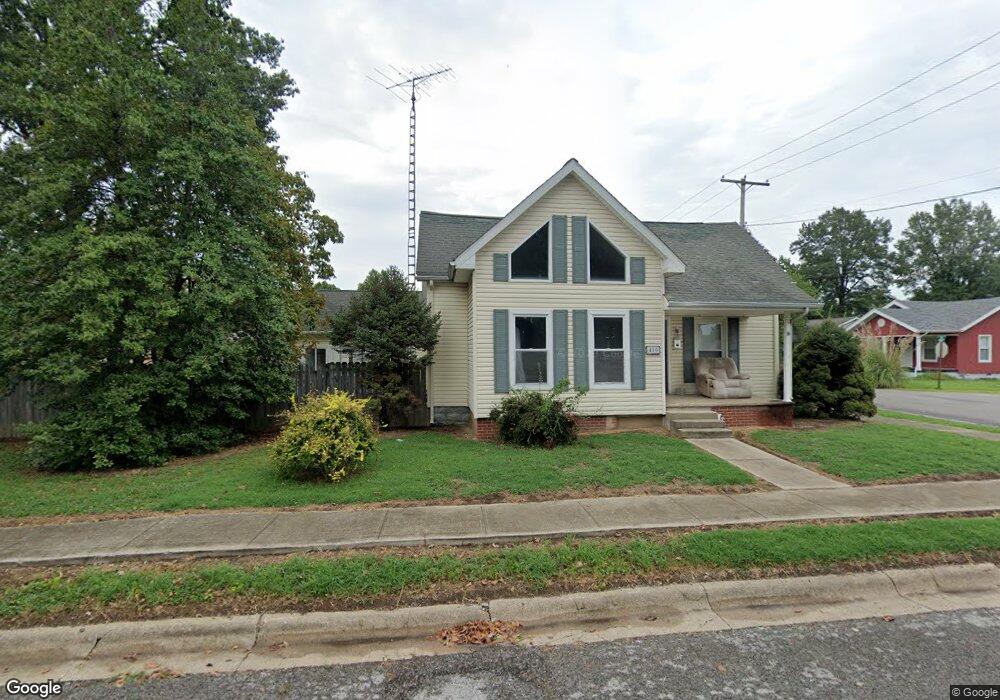
410 E 7th St Johnston City, IL 62951
Estimated Value: $114,000 - $168,417
Studio
--
Bath
1,827
Sq Ft
$79/Sq Ft
Est. Value
About This Home
This home is located at 410 E 7th St, Johnston City, IL 62951 and is currently estimated at $144,104, approximately $78 per square foot. 410 E 7th St is a home located in Williamson County with nearby schools including Johnston City High School and Community Christian Academy.
Ownership History
Date
Name
Owned For
Owner Type
Purchase Details
Closed on
Sep 24, 2024
Sold by
Sizemore Benjamin Dale
Bought by
Rash Trisha D
Current Estimated Value
Purchase Details
Closed on
Jul 22, 2020
Sold by
11T Il Llc
Bought by
Sizemore Benjamin Dale
Purchase Details
Closed on
Jan 6, 2020
Sold by
Guardian Tax Il Llc
Bought by
11T Il Llc
Purchase Details
Closed on
Oct 24, 2019
Sold by
County Clerk Of The County Of Williamson
Bought by
Guardian Tax Il Llc
Create a Home Valuation Report for This Property
The Home Valuation Report is an in-depth analysis detailing your home's value as well as a comparison with similar homes in the area
Home Values in the Area
Average Home Value in this Area
Purchase History
| Date | Buyer | Sale Price | Title Company |
|---|---|---|---|
| Rash Trisha D | -- | None Listed On Document | |
| Rash Trisha D | -- | None Listed On Document | |
| Sizemore Benjamin Dale | $37,000 | Wheatland Title | |
| 11T Il Llc | -- | Heid Law Offices Llc | |
| Guardian Tax Il Llc | -- | -- |
Source: Public Records
Tax History
| Year | Tax Paid | Tax Assessment Tax Assessment Total Assessment is a certain percentage of the fair market value that is determined by local assessors to be the total taxable value of land and additions on the property. | Land | Improvement |
|---|---|---|---|---|
| 2025 | $3,350 | $41,050 | $2,770 | $38,280 |
| 2024 | $3,356 | $41,050 | $2,770 | $38,280 |
| 2023 | $3,350 | $41,050 | $2,770 | $38,280 |
| 2022 | $1,740 | $29,160 | $2,440 | $26,720 |
| 2021 | $4,814 | $19,520 | $2,350 | $17,170 |
| 2020 | $4,814 | $51,820 | $2,220 | $49,600 |
| 2019 | $3,973 | $51,820 | $2,220 | $49,600 |
| 2018 | $3,973 | $51,820 | $2,220 | $49,600 |
| 2017 | $3,942 | $51,820 | $2,220 | $49,600 |
| 2015 | $3,867 | $49,080 | $2,100 | $46,980 |
| 2013 | $3,390 | $49,080 | $2,100 | $46,980 |
| 2012 | $3,390 | $49,080 | $2,100 | $46,980 |
Source: Public Records
Map
Nearby Homes
- 1011 Newton Ave
- 1205 Burgess Ave
- 200 W 12th St
- 1313 Newton Ave
- 409 W 13th St
- TBD Harris School Rd
- 800 W 11th St
- Lot 16 Joy Ln
- Lot 17 Joy Ln
- Lot 18 Joy Ln
- Lot 19 Joy Ln
- 14107 German Church Rd
- 17064 Old Frankfort Rd
- 13261 N Casey Rd
- 17666 Illinois 37
- 12195 Blue Sky Dr
- 17928 Route 37
- 12754 Pease Rd
- 0000 S County Line Rd
- 12230 Binkley Rd
Your Personal Tour Guide
Ask me questions while you tour the home.