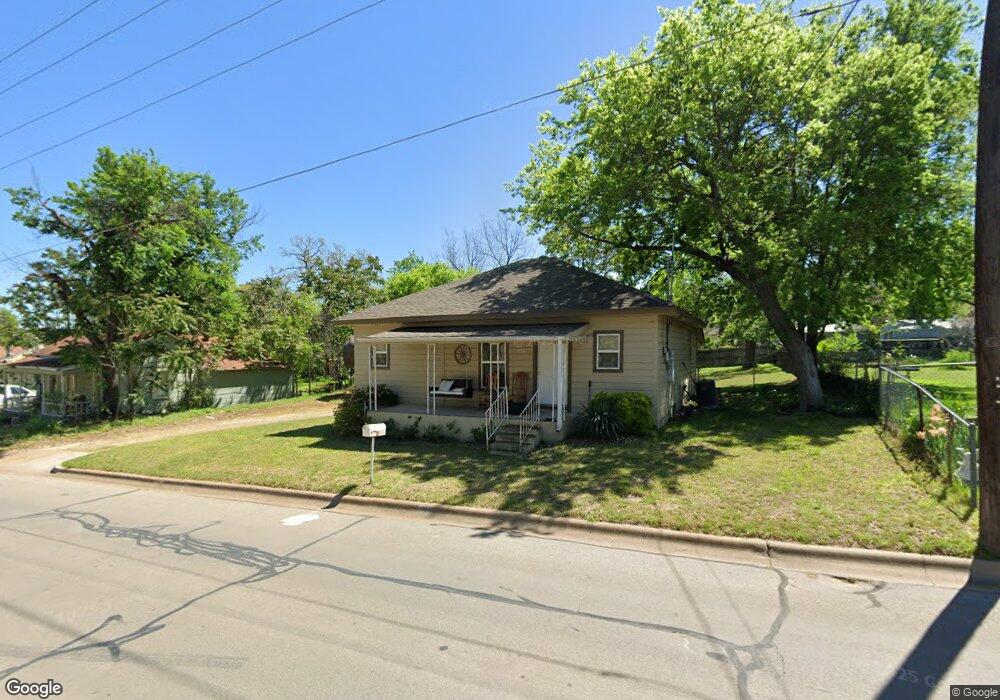
410 E Lee Ave Weatherford, TX 76086
Estimated Value: $194,237 - $239,000
2
Beds
1
Bath
945
Sq Ft
$227/Sq Ft
Est. Value
About This Home
This home is located at 410 E Lee Ave, Weatherford, TX 76086 and is currently estimated at $214,809, approximately $227 per square foot. 410 E Lee Ave is a home located in Parker County with nearby schools including Ikard Elementary School, Hall Middle School, and Weatherford High School.
Ownership History
Date
Name
Owned For
Owner Type
Purchase Details
Closed on
Dec 13, 2013
Sold by
Ornelas John and Ornelas Marie
Bought by
Thornton Joseph
Current Estimated Value
Purchase Details
Closed on
Jan 4, 2010
Sold by
Sapp Michael P and Sapp Frances
Bought by
Thornton Joseph
Home Financials for this Owner
Home Financials are based on the most recent Mortgage that was taken out on this home.
Original Mortgage
$60,000
Interest Rate
4.82%
Mortgage Type
Seller Take Back
Purchase Details
Closed on
Dec 27, 2007
Sold by
Jamn Main Llc
Bought by
Thornton Joseph
Purchase Details
Closed on
Sep 7, 2007
Sold by
Baker Edgar R
Bought by
Thornton Joseph
Purchase Details
Closed on
Jan 1, 1901
Sold by
Harris Estate
Bought by
Thornton Joseph
Create a Home Valuation Report for This Property
The Home Valuation Report is an in-depth analysis detailing your home's value as well as a comparison with similar homes in the area
Home Values in the Area
Average Home Value in this Area
Purchase History
| Date | Buyer | Sale Price | Title Company |
|---|---|---|---|
| Thornton Joseph | -- | None Available | |
| Thornton Joseph | -- | -- | |
| Ornelas John | -- | Stnt | |
| Thornton Joseph | -- | -- | |
| Sapp Michael P | -- | None Available | |
| Thornton Joseph | -- | -- | |
| Jamn Main Llc | -- | Stnt | |
| Thornton Joseph | -- | -- |
Source: Public Records
Mortgage History
| Date | Status | Borrower | Loan Amount |
|---|---|---|---|
| Previous Owner | Ornelas John | $60,000 |
Source: Public Records
Tax History Compared to Growth
Tax History
| Year | Tax Paid | Tax Assessment Tax Assessment Total Assessment is a certain percentage of the fair market value that is determined by local assessors to be the total taxable value of land and additions on the property. | Land | Improvement |
|---|---|---|---|---|
| 2025 | $609 | $149,435 | -- | -- |
| 2024 | $609 | $135,850 | -- | -- |
| 2023 | $609 | $123,500 | $0 | $0 |
| 2022 | $2,491 | $113,660 | $15,000 | $98,660 |
| 2021 | $2,451 | $113,660 | $15,000 | $98,660 |
| 2020 | $2,242 | $93,380 | $15,000 | $78,380 |
| 2019 | $2,154 | $93,380 | $15,000 | $78,380 |
| 2018 | $1,967 | $76,690 | $15,000 | $61,690 |
| 2017 | $1,920 | $76,690 | $15,000 | $61,690 |
| 2016 | $1,745 | $66,330 | $15,000 | $51,330 |
| 2015 | $819 | $66,330 | $15,000 | $51,330 |
| 2014 | $964 | $63,250 | $15,000 | $48,250 |
Source: Public Records
Map
Nearby Homes
- 414 E Lee Ave
- 406 E Lee Ave
- Lot 12 Blk J Town Creek Cir
- TBD Cortez Trail
- TBD I-20 W
- TBD4 Town Creek Cir
- TBD2 Town Creek Cir
- TBD Town Creek Cir
- 418 E Lee Ave
- 404 E Lee Ave
- 413 E Lee Ave
- 411 E Lee Ave
- 405 E Lee Ave
- 403 S Rusk St
- 402 E Lee Ave
- 323 S Rusk St
- 407 S Rusk St
- 420 E Lee Ave
- 411 E Josephine St
- 417 E Lee Ave