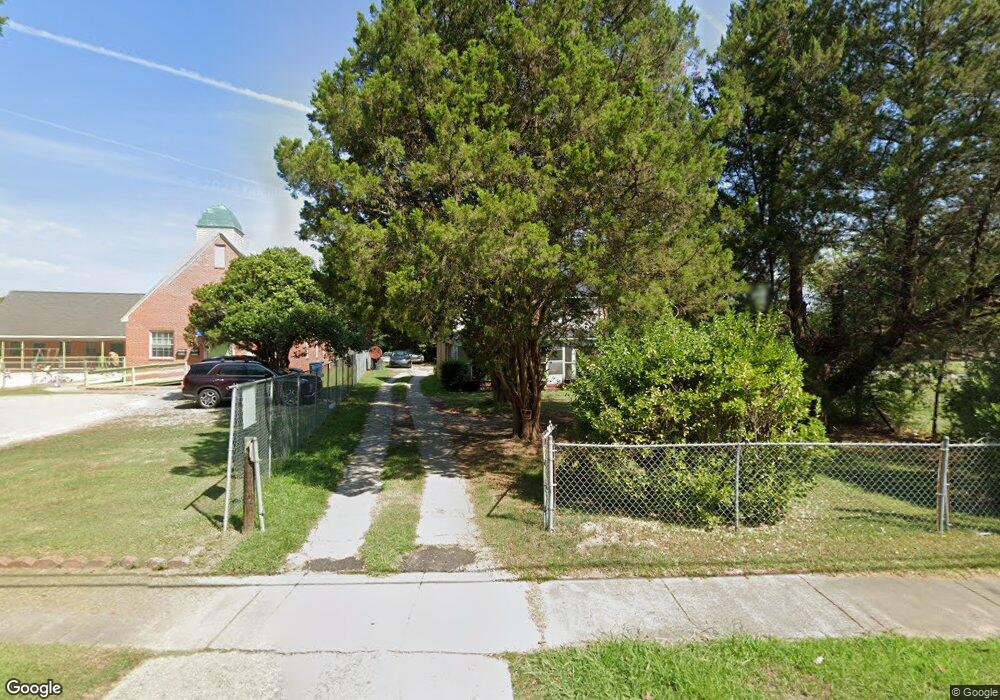
410 E Main St Plymouth, NC 27962
Estimated Value: $43,000 - $60,029
--
Bed
2
Baths
520
Sq Ft
$96/Sq Ft
Est. Value
About This Home
This home is located at 410 E Main St, Plymouth, NC 27962 and is currently estimated at $50,007, approximately $96 per square foot. 410 E Main St is a home located in Washington County with nearby schools including Pines Elementary School, Washington County Middle, and Washington County High.
Ownership History
Date
Name
Owned For
Owner Type
Purchase Details
Closed on
Jan 10, 2025
Sold by
Williams Adriese and Williams Kristie
Bought by
Davila Esmeralda
Current Estimated Value
Home Financials for this Owner
Home Financials are based on the most recent Mortgage that was taken out on this home.
Original Mortgage
$48,000
Outstanding Balance
$46,652
Interest Rate
5.96%
Mortgage Type
Seller Take Back
Estimated Equity
$3,355
Purchase Details
Closed on
Jul 10, 2024
Sold by
Shellpoint Mortgage Servicing and Newrez Llc
Bought by
Williams Adriese
Purchase Details
Closed on
Apr 11, 2024
Sold by
Goddard & Peterson Pllc
Bought by
Shellpoint Mortgage Servicing and Newrez Llc
Purchase Details
Closed on
Dec 4, 2008
Sold by
Toodle Virginia Y and Toodle Robert
Bought by
Toodle Virginia Y and Toodle Robert
Create a Home Valuation Report for This Property
The Home Valuation Report is an in-depth analysis detailing your home's value as well as a comparison with similar homes in the area
Home Values in the Area
Average Home Value in this Area
Purchase History
| Date | Buyer | Sale Price | Title Company |
|---|---|---|---|
| Davila Esmeralda | $55,000 | None Listed On Document | |
| Davila Esmeralda | $55,000 | None Listed On Document | |
| Williams Adriese | $33,500 | None Listed On Document | |
| Shellpoint Mortgage Servicing | $34,500 | None Listed On Document | |
| Toodle Virginia Y | -- | None Available |
Source: Public Records
Mortgage History
| Date | Status | Borrower | Loan Amount |
|---|---|---|---|
| Open | Davila Esmeralda | $48,000 | |
| Closed | Davila Esmeralda | $48,000 |
Source: Public Records
Tax History Compared to Growth
Tax History
| Year | Tax Paid | Tax Assessment Tax Assessment Total Assessment is a certain percentage of the fair market value that is determined by local assessors to be the total taxable value of land and additions on the property. | Land | Improvement |
|---|---|---|---|---|
| 2025 | $367 | $44,000 | $12,300 | $31,700 |
| 2024 | $367 | $44,000 | $12,300 | $31,700 |
| 2023 | $367 | $44,000 | $12,300 | $31,700 |
| 2022 | $367 | $0 | $0 | $0 |
| 2021 | $367 | $44,000 | $12,300 | $31,700 |
| 2020 | $342 | $40,800 | $12,300 | $28,500 |
| 2019 | $342 | $40,800 | $12,300 | $28,500 |
| 2018 | $342 | $40,800 | $12,300 | $28,500 |
| 2017 | $349 | $40,800 | $12,300 | $28,500 |
| 2016 | $330 | $40,800 | $12,300 | $28,500 |
| 2015 | $277 | $40,800 | $12,300 | $28,500 |
| 2014 | $277 | $40,800 | $12,300 | $28,500 |
| 2013 | $277 | $40,800 | $12,300 | $28,500 |
Source: Public Records
Map
Nearby Homes
- 302 E Main St
- 202 Madison St
- 403 Washington St
- 527 Washington St
- 113 Brinkley Ave
- 540 Jefferson St
- 303 Winesett Cir
- 206 Brinkley Ave
- 0 N Carolina 32
- 0 U S Highway 64
- 113 Winesett Cir
- 1222 Wilson Street Extension
- 318 Gen Pettigrew Dr
- 115 Quail Dr
- Lot 8 Quail Dr
- 0 N River
- 807 Roosevelt Ave
- 309 West Ave
- 207 West Ave
- 604 Wilson St