Estimated Value: $246,125 - $283,000
3
Beds
2
Baths
1,056
Sq Ft
$244/Sq Ft
Est. Value
About This Home
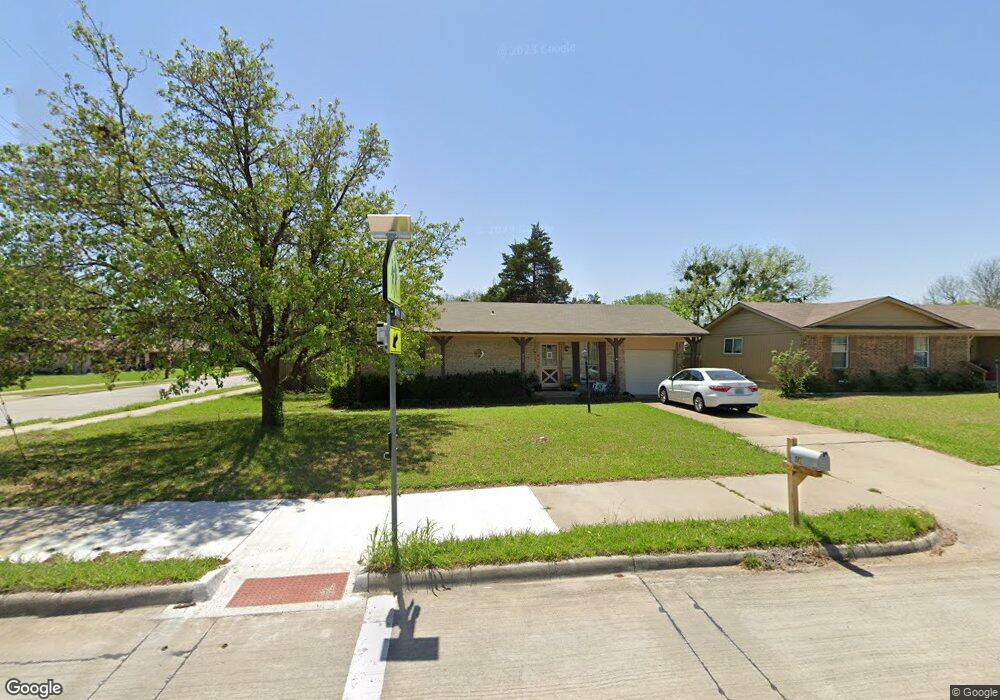
This home is located at 410 E Stone Rd, Wylie, TX 75098 and is currently estimated at $257,281, approximately $243 per square foot. 410 E Stone Rd is a home located in Collin County with nearby schools including R F Hartman Elementary School, AB Harrison Intermediate School, and Grady Burnett J High School.
Ownership History
Date
Name
Owned For
Owner Type
Purchase Details
Closed on
Dec 10, 2024
Sold by
Tallant Rentals Llc
Bought by
Residential Holdings Llc
Current Estimated Value
Home Financials for this Owner
Home Financials are based on the most recent Mortgage that was taken out on this home.
Original Mortgage
$150,000
Outstanding Balance
$130,575
Interest Rate
6.72%
Mortgage Type
New Conventional
Estimated Equity
$126,706
Purchase Details
Closed on
Feb 19, 2010
Sold by
Federal Home Loan Mortgage Corporation
Bought by
Tallant Rentals Llc
Purchase Details
Closed on
Jan 5, 2010
Sold by
Price Kyle
Bought by
Federal Home Loan Mortgage Corp
Purchase Details
Closed on
Dec 14, 2006
Sold by
Vaughn Betty Doris and Caudill Linda Carol
Bought by
Price Kyle
Home Financials for this Owner
Home Financials are based on the most recent Mortgage that was taken out on this home.
Original Mortgage
$93,080
Interest Rate
6.31%
Mortgage Type
Purchase Money Mortgage
Create a Home Valuation Report for This Property
The Home Valuation Report is an in-depth analysis detailing your home's value as well as a comparison with similar homes in the area
Home Values in the Area
Average Home Value in this Area
Purchase History
| Date | Buyer | Sale Price | Title Company |
|---|---|---|---|
| Residential Holdings Llc | -- | None Listed On Document | |
| Tallant Rentals Llc | -- | Fnt | |
| Tallant Rentals Llc | -- | Fnt | |
| Federal Home Loan Mortgage Corp | $68,850 | None Available | |
| Price Kyle | -- | Ctic |
Source: Public Records
Mortgage History
| Date | Status | Borrower | Loan Amount |
|---|---|---|---|
| Open | Residential Holdings Llc | $150,000 | |
| Previous Owner | Price Kyle | $93,080 |
Source: Public Records
Tax History Compared to Growth
Tax History
| Year | Tax Paid | Tax Assessment Tax Assessment Total Assessment is a certain percentage of the fair market value that is determined by local assessors to be the total taxable value of land and additions on the property. | Land | Improvement |
|---|---|---|---|---|
| 2025 | $4,019 | $190,273 | $64,838 | $125,435 |
| 2024 | $4,019 | $203,502 | $54,863 | $148,639 |
| 2023 | $4,019 | $214,709 | $54,863 | $159,846 |
| 2022 | $4,413 | $201,128 | $44,888 | $156,240 |
| 2021 | $2,603 | $110,629 | $39,900 | $70,729 |
| 2020 | $2,409 | $97,000 | $39,900 | $57,100 |
| 2019 | $3,083 | $117,312 | $39,900 | $77,412 |
| 2018 | $2,935 | $109,000 | $39,900 | $69,100 |
| 2017 | $2,316 | $86,000 | $29,925 | $56,075 |
| 2016 | $1,993 | $71,730 | $22,444 | $49,286 |
| 2015 | $1,866 | $68,145 | $22,444 | $45,701 |
Source: Public Records
Map
Nearby Homes
- 414 Briarwood Dr
- 416 S 1st St
- 327 S 4th St
- 329 S 2nd St
- 416 Dogwood Dr
- 702 S Ballard Ave
- 217 Cloudcroft Dr
- 300 Woodhollow Ct
- 306 Woodhollow Ct
- 301 S 3rd St
- 1306 Angel Fire Dr
- 811 Forest Edge Ln
- 307 Memorial Dr
- 104 Rushcreek Dr
- 401 Willow Way
- 825 Forest Edge Ln
- 804 Memorial Dr
- 820 Foxwood Ln
- 406 Willow Way
- 903 Mardi Gras Ln
- 408 E Stone Rd
- 406 E Stone Rd
- 501 Hilltop Ln
- 411 Duncan Way
- 409 Duncan Way
- 503 Hilltop Ln
- 404 E Stone Rd
- 407 Duncan Way
- 505 Hilltop Ln
- 429 S 4th St
- 433 S 4th St Unit 435
- 405 Duncan Way
- 402 E Stone Rd
- 507 Hilltop Ln
- 437 S 4th St
- 414 Hilltop Ln
- 439 S 4th St
- 439 S 4th St Unit 437
- 403 Duncan Way
- 431 S 4th St