410 Fall Creek Dr Tillamook, OR 97141
Estimated Value: $1,070,000 - $1,192,000
6
Beds
3
Baths
3,694
Sq Ft
$305/Sq Ft
Est. Value
About This Home
This home is located at 410 Fall Creek Dr, Tillamook, OR 97141 and is currently estimated at $1,126,149, approximately $304 per square foot. 410 Fall Creek Dr is a home with nearby schools including Tillamook High School.
Ownership History
Date
Name
Owned For
Owner Type
Purchase Details
Closed on
Jul 11, 2025
Sold by
Curtis Connie A and Curtis Thomas B
Bought by
Thomas Curtis Living Trust and Curtis
Current Estimated Value
Purchase Details
Closed on
Jul 27, 2023
Sold by
Feltman Remainder Family Trust
Bought by
Curtis Connie A and Curtis Thomas B
Home Financials for this Owner
Home Financials are based on the most recent Mortgage that was taken out on this home.
Original Mortgage
$379,000
Interest Rate
6.69%
Mortgage Type
New Conventional
Purchase Details
Closed on
Aug 5, 2021
Sold by
Feltman Joint Living Trust and Feltman James A
Bought by
Feltman Remainder Family Trust and Feltman
Purchase Details
Closed on
Jul 29, 2021
Sold by
Feltman James A and Feltman Joint Living Trust
Bought by
Feltman James A and Feltman Survivors Trust
Purchase Details
Closed on
Jul 18, 2013
Sold by
Feltman James and Feltman Mary
Bought by
Feltman James A and Feltman Mary K
Create a Home Valuation Report for This Property
The Home Valuation Report is an in-depth analysis detailing your home's value as well as a comparison with similar homes in the area
Home Values in the Area
Average Home Value in this Area
Purchase History
| Date | Buyer | Sale Price | Title Company |
|---|---|---|---|
| Thomas Curtis Living Trust | -- | None Listed On Document | |
| Curtis Connie A | $1,079,000 | Ticor Title | |
| Feltman Remainder Family Trust | -- | None Listed On Document | |
| Feltman James A | -- | None Available | |
| Feltman James A | -- | None Available |
Source: Public Records
Mortgage History
| Date | Status | Borrower | Loan Amount |
|---|---|---|---|
| Previous Owner | Curtis Connie A | $379,000 |
Source: Public Records
Tax History Compared to Growth
Tax History
| Year | Tax Paid | Tax Assessment Tax Assessment Total Assessment is a certain percentage of the fair market value that is determined by local assessors to be the total taxable value of land and additions on the property. | Land | Improvement |
|---|---|---|---|---|
| 2024 | $8,191 | $650,670 | $121,780 | $528,890 |
| 2023 | $8,048 | $623,110 | $118,230 | $504,880 |
| 2022 | $7,822 | $604,970 | $114,780 | $490,190 |
| 2021 | $7,644 | $587,350 | $111,440 | $475,910 |
| 2020 | $7,477 | $570,250 | $108,190 | $462,060 |
| 2019 | $7,361 | $553,650 | $105,040 | $448,610 |
| 2018 | $6,969 | $537,530 | $101,970 | $435,560 |
| 2017 | $6,975 | $532,470 | $96,310 | $436,160 |
| 2016 | $6,782 | $518,970 | $98,440 | $420,530 |
| 2015 | $6,270 | $472,350 | $99,080 | $373,270 |
| 2014 | $6,664 | $493,650 | $161,550 | $332,100 |
| 2013 | -- | $495,830 | $156,950 | $338,880 |
Source: Public Records
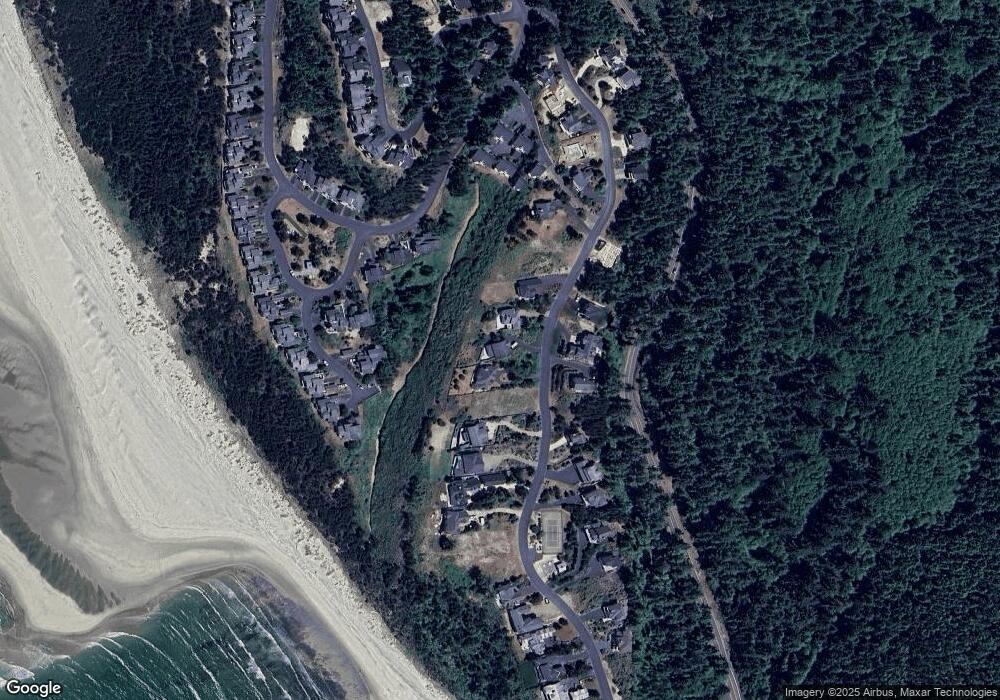
Map
Nearby Homes
- 415 Fall Creek Dr
- 405 Fall Creek Dr
- 405 Fall Creek Dr
- 455 Capes Dr
- 250 Capes Dr
- Lot 1 Highland Dr
- 140 Breezee Way
- 0 Breezee Way Unit 2Lots 24287783
- 0 Breezee Way Unit 2620/2621 23-90
- 0 Breezee Way Unit TL 2618 25-511
- 140 Breezee Way
- 110 Crescent St
- 0 Breezee Way Tl 2618
- 0 Ava-Lot 7 Place Unit 769929393
- 0 Crescent St Unit 12&13 614513147
- 120 Crescent St
- 0 Crescent St Unit 12 & 13 25-409
- 0 Ava-Lot 9 Place Unit 706010284
- 0 Ava-Lot 6 Place Unit 679421242
- 0 Ava-Lot 8 Place Unit 483669701
- 410 Fall Creek Dr
- 400 Fall Creek Dr
- 420 Fall Creek Dr
- 400 Fall Creek Dr Unit Oceanside, Or 97134
- 400 Fall Creek Dr
- 137 Fall Creek Dr
- 138 Fall Creek Dr
- #147 Fall Creek Dr
- 147 Fall Creek Dr
- Lot 139 Fall Creek Dr
- 117 Fall Creek Dr
- 128 Fall Creek Dr
- 141 Fall Creek Dr
- VL 117 Fall Creek Dr
- Lot 112 Fall Creek Dr
- VL 156 Fall Creek Dr
- 430 Fall Creek Dr
- 430 Fall Creek Dr
- 390 Fall Creek Dr
- 390 Fall Creek Dr Unit 147