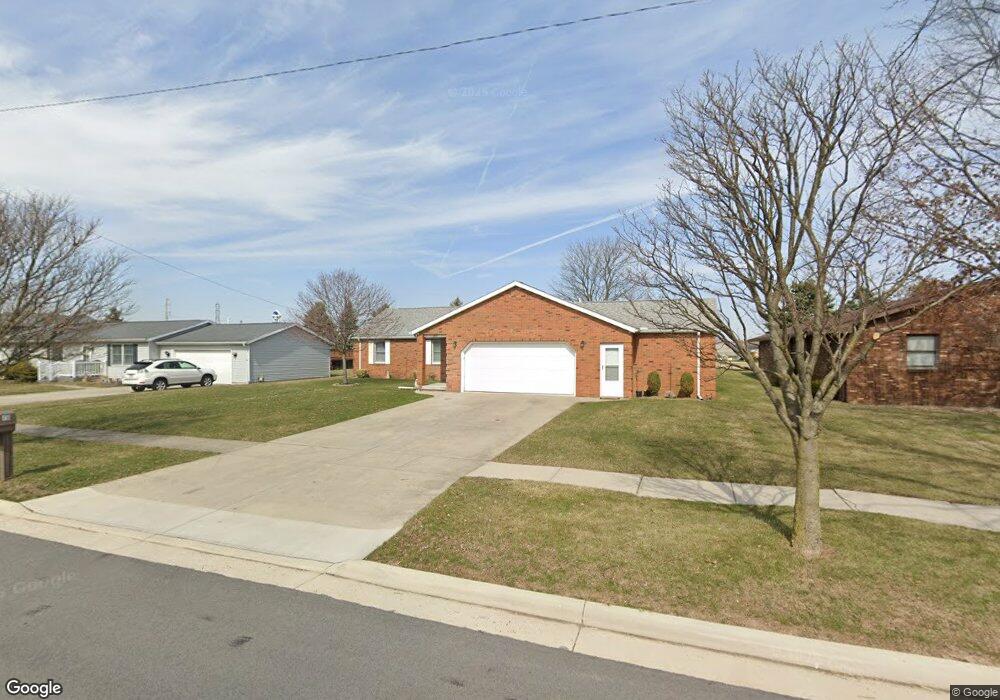
410 Hillshafer Dr Findlay, OH 45840
Estimated Value: $236,000 - $254,000
3
Beds
2
Baths
1,458
Sq Ft
$169/Sq Ft
Est. Value
About This Home
This home is located at 410 Hillshafer Dr, Findlay, OH 45840 and is currently estimated at $246,148, approximately $168 per square foot. 410 Hillshafer Dr is a home located in Hancock County with nearby schools including Bigelow Hill Elementary School, Northview Elementary School, and Glenwood Middle School.
Ownership History
Date
Name
Owned For
Owner Type
Purchase Details
Closed on
Feb 1, 2020
Sold by
Hipp Rachel L and Estate Of Rosemary L Tritch
Bought by
Ratliff Galen N and Ratliff Kimberly L
Current Estimated Value
Home Financials for this Owner
Home Financials are based on the most recent Mortgage that was taken out on this home.
Original Mortgage
$160,200
Interest Rate
2.67%
Mortgage Type
Future Advance Clause Open End Mortgage
Purchase Details
Closed on
Sep 30, 2015
Bought by
Tritch Donald M and Tritch Rosemary L
Home Financials for this Owner
Home Financials are based on the most recent Mortgage that was taken out on this home.
Interest Rate
3.86%
Purchase Details
Closed on
Oct 11, 1988
Bought by
Tritch Don and Tritch Rosemary
Purchase Details
Closed on
Jan 11, 1988
Bought by
Mid State Homes Inc
Purchase Details
Closed on
Oct 2, 1987
Bought by
Shehata Dr Said
Purchase Details
Closed on
Mar 11, 1983
Bought by
Jaroush Ameen
Create a Home Valuation Report for This Property
The Home Valuation Report is an in-depth analysis detailing your home's value as well as a comparison with similar homes in the area
Home Values in the Area
Average Home Value in this Area
Purchase History
| Date | Buyer | Sale Price | Title Company |
|---|---|---|---|
| Ratliff Galen N | $178,000 | Assured Title Agency | |
| Tritch Donald M | -- | -- | |
| Tritch Don | $12,100 | -- | |
| Mid State Homes Inc | -- | -- | |
| Shehata Dr Said | -- | -- | |
| Jaroush Ameen | -- | -- |
Source: Public Records
Mortgage History
| Date | Status | Borrower | Loan Amount |
|---|---|---|---|
| Previous Owner | Ratliff Galen N | $160,200 | |
| Previous Owner | Tritch Donald M | -- |
Source: Public Records
Tax History
| Year | Tax Paid | Tax Assessment Tax Assessment Total Assessment is a certain percentage of the fair market value that is determined by local assessors to be the total taxable value of land and additions on the property. | Land | Improvement |
|---|---|---|---|---|
| 2024 | $2,376 | $66,890 | $10,080 | $56,810 |
| 2023 | $2,380 | $66,890 | $10,080 | $56,810 |
| 2022 | $2,371 | $66,890 | $10,080 | $56,810 |
| 2021 | $2,417 | $59,380 | $9,690 | $49,690 |
| 2020 | $2,417 | $59,380 | $9,690 | $49,690 |
| 2019 | $2,019 | $59,380 | $9,690 | $49,690 |
| 2018 | $1,864 | $51,640 | $8,430 | $43,210 |
| 2017 | $1,865 | $51,640 | $8,430 | $43,210 |
| 2016 | $1,841 | $51,640 | $8,430 | $43,210 |
| 2015 | $1,930 | $52,890 | $10,230 | $42,660 |
| 2014 | $1,930 | $52,890 | $10,230 | $42,660 |
| 2012 | $1,944 | $52,890 | $10,230 | $42,660 |
Source: Public Records
Map
Nearby Homes
- 3315 Norcrest St
- 3239 N Main St
- 0 Township Highway 99
- 12325 Township Highway 99
- 323 W Bigelow Ave
- 3237 Gleneagle Dr
- 227 Terrace Dr
- 201 Bell Ave
- 400 Rosewood Ave
- 0 Allen Township 142
- 128 Harrington Ave
- 2604 N Main St
- 3018 Gleneagle Dr
- 4417 County Road 220
- 3106 Saddlebrook
- 636 W Melrose Ave
- 329 W Melrose Ave
- 315 W Melrose Ave
- 241 Stanley Ave
- 701 W Melrose Ave
- 404 Hillshafer Dr
- 414 Hillshafer Dr
- 400 Hillshafer Dr
- 420 Hillshafer Dr
- 409 Hillshafer Dr
- 413 Hillshafer Dr
- 405 Hillshafer Dr
- 340 Hillshafer Dr
- 424 Hillshafer Dr
- 417 Hillshafer Dr
- 401 Hillshafer Dr
- 3413 Crosshill Dr
- 332 Hillshafer Dr
- 3331 Norcrest St
- 3401 Norcrest St
- 3327 Norcrest St
- 3407 Norcrest St
- 339 Hillshafer Dr
- 3415 Norcrest St
- 324 Hillshafer Dr
Your Personal Tour Guide
Ask me questions while you tour the home.