Estimated Value: $172,000 - $176,008
3
Beds
1
Bath
960
Sq Ft
$182/Sq Ft
Est. Value
About This Home
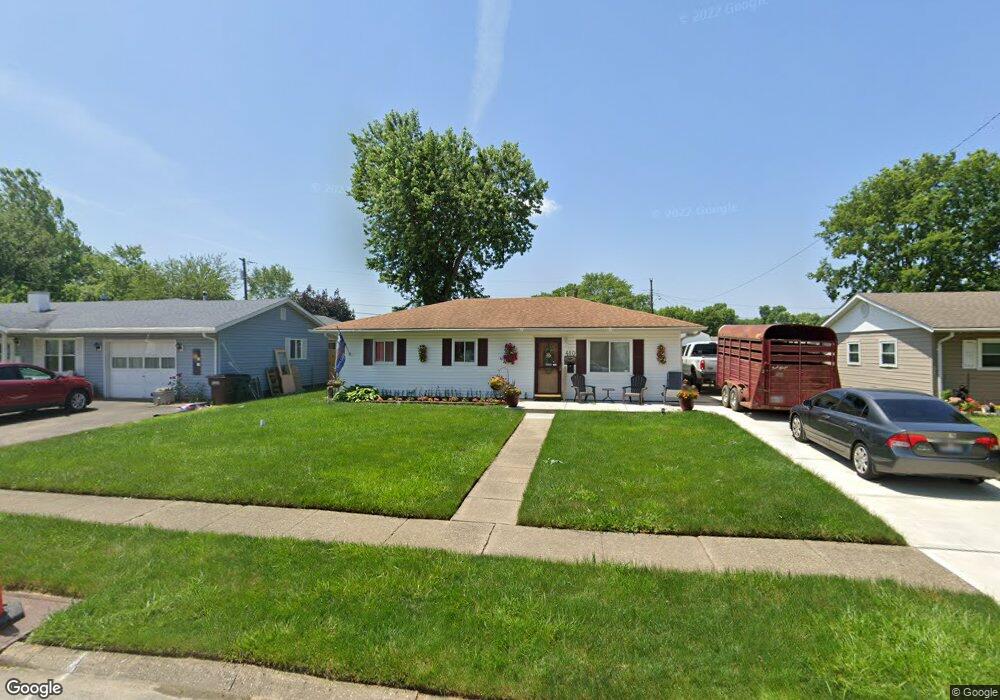
This home is located at 410 Layne Dr, Xenia, OH 45385 and is currently estimated at $174,502, approximately $181 per square foot. 410 Layne Dr is a home located in Greene County with nearby schools including Xenia High School, Summit Academy Community School for Alternative Learners - Xenia, and Legacy Christian Academy.
Ownership History
Date
Name
Owned For
Owner Type
Purchase Details
Closed on
Sep 30, 2022
Sold by
Schweller Justin A and Schweller Rebecca
Bought by
Simic Thomas David
Current Estimated Value
Home Financials for this Owner
Home Financials are based on the most recent Mortgage that was taken out on this home.
Original Mortgage
$140,505
Outstanding Balance
$134,841
Interest Rate
5.66%
Mortgage Type
New Conventional
Estimated Equity
$39,661
Purchase Details
Closed on
Dec 11, 2003
Sold by
Teeters Richard P and Teeters Frances B
Bought by
Schweller Justin A
Home Financials for this Owner
Home Financials are based on the most recent Mortgage that was taken out on this home.
Original Mortgage
$81,963
Interest Rate
5.84%
Mortgage Type
FHA
Purchase Details
Closed on
Jul 22, 2002
Sold by
George Billie Jo
Bought by
Teeters Richard P and Teeters Frances B
Purchase Details
Closed on
Jul 16, 2002
Sold by
George Billie Jo
Bought by
Teeters Richard P and Teeters Frances B
Create a Home Valuation Report for This Property
The Home Valuation Report is an in-depth analysis detailing your home's value as well as a comparison with similar homes in the area
Home Values in the Area
Average Home Value in this Area
Purchase History
| Date | Buyer | Sale Price | Title Company |
|---|---|---|---|
| Simic Thomas David | -- | -- | |
| Schweller Justin A | $83,300 | -- | |
| Teeters Richard P | $48,000 | -- | |
| Teeters Richard P | $48,000 | -- |
Source: Public Records
Mortgage History
| Date | Status | Borrower | Loan Amount |
|---|---|---|---|
| Open | Simic Thomas David | $140,505 | |
| Previous Owner | Schweller Justin A | $81,963 |
Source: Public Records
Tax History Compared to Growth
Tax History
| Year | Tax Paid | Tax Assessment Tax Assessment Total Assessment is a certain percentage of the fair market value that is determined by local assessors to be the total taxable value of land and additions on the property. | Land | Improvement |
|---|---|---|---|---|
| 2024 | $1,708 | $37,720 | $10,650 | $27,070 |
| 2023 | $1,708 | $37,720 | $10,650 | $27,070 |
| 2022 | $1,322 | $26,350 | $7,610 | $18,740 |
| 2021 | $1,340 | $26,350 | $7,610 | $18,740 |
| 2020 | $1,284 | $26,350 | $7,610 | $18,740 |
| 2019 | $1,041 | $20,120 | $5,490 | $14,630 |
| 2018 | $1,045 | $20,120 | $5,490 | $14,630 |
| 2017 | $993 | $20,120 | $5,490 | $14,630 |
| 2016 | $994 | $18,770 | $5,490 | $13,280 |
| 2015 | $996 | $18,770 | $5,490 | $13,280 |
| 2014 | $954 | $18,770 | $5,490 | $13,280 |
Source: Public Records
Map
Nearby Homes
- 343 Sheelin Rd
- 912 Omard Dr
- 883 Omard Dr
- 1351 Omard Dr
- 509 Antrim Rd
- 1223 June Dr
- 1233 June Dr
- 1283 June Dr
- 1391 June Dr
- 1342 Kylemore Dr
- 613 N West St
- 305-325 Bellbrook Ave
- 137 Pleasant St
- 516 N King St
- 1144 Rockwell Dr
- 121 S Progress Dr
- 659 N King St
- 878 N Detroit St
- 902 N Detroit St
- 453 Walnut St