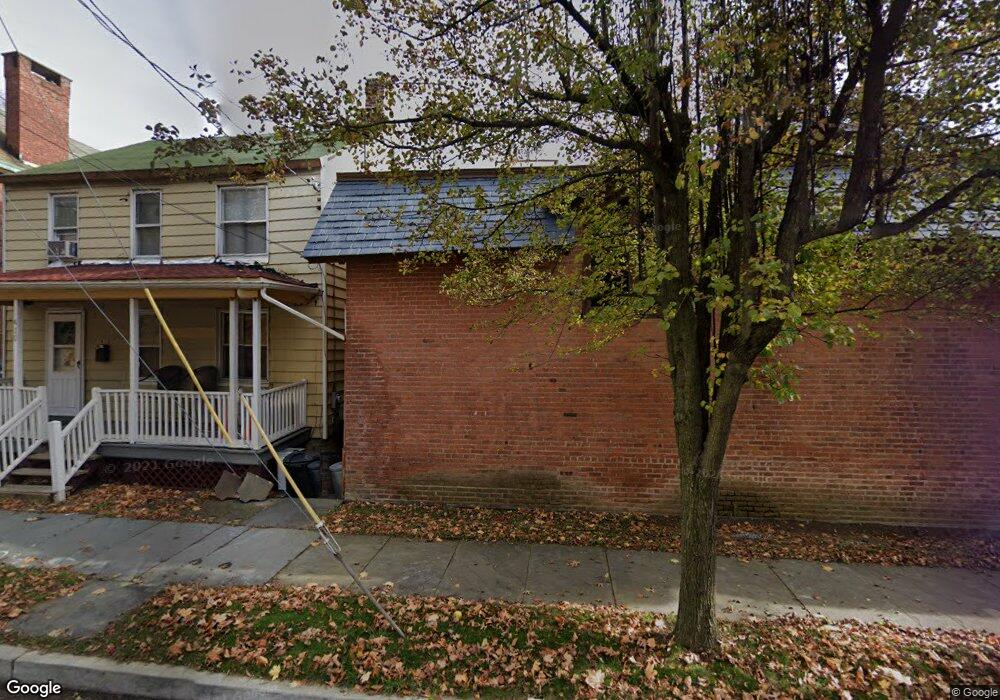
410 Liberty St Newburgh, NY 12550
Estimated Value: $185,000 - $322,000
3
Beds
1
Bath
1,056
Sq Ft
$228/Sq Ft
Est. Value
About This Home
This home is located at 410 Liberty St, Newburgh, NY 12550 and is currently estimated at $240,310, approximately $227 per square foot. 410 Liberty St is a home located in Orange County with nearby schools including Newburgh Free Academy Main Campus, Bishop Dunn Memorial, and Nora Cronin Presentation Academy.
Ownership History
Date
Name
Owned For
Owner Type
Purchase Details
Closed on
Jun 12, 2021
Sold by
Barnhart Ryan
Bought by
Rojas Lorenzo and Rojas Lorenzo A
Current Estimated Value
Home Financials for this Owner
Home Financials are based on the most recent Mortgage that was taken out on this home.
Original Mortgage
$6,960
Outstanding Balance
$6,301
Interest Rate
2.9%
Mortgage Type
Stand Alone Refi Refinance Of Original Loan
Estimated Equity
$234,009
Purchase Details
Closed on
Jun 1, 2021
Sold by
Youngquest Georgia L and Youngquest Benjamin C
Bought by
Mann Jordon and Mann Jaclyn
Home Financials for this Owner
Home Financials are based on the most recent Mortgage that was taken out on this home.
Original Mortgage
$6,960
Outstanding Balance
$6,301
Interest Rate
2.9%
Mortgage Type
Stand Alone Refi Refinance Of Original Loan
Estimated Equity
$234,009
Purchase Details
Closed on
Jan 5, 1998
Sold by
The City Of Newburgh
Bought by
Dour Daniel J
Create a Home Valuation Report for This Property
The Home Valuation Report is an in-depth analysis detailing your home's value as well as a comparison with similar homes in the area
Home Values in the Area
Average Home Value in this Area
Purchase History
| Date | Buyer | Sale Price | Title Company |
|---|---|---|---|
| Rojas Lorenzo | $350,000 | None Available | |
| Mann Jordon | $232,000 | None Available | |
| Dour Daniel J | $6,000 | -- |
Source: Public Records
Mortgage History
| Date | Status | Borrower | Loan Amount |
|---|---|---|---|
| Open | Mann Jordon | $6,960 |
Source: Public Records
Tax History Compared to Growth
Tax History
| Year | Tax Paid | Tax Assessment Tax Assessment Total Assessment is a certain percentage of the fair market value that is determined by local assessors to be the total taxable value of land and additions on the property. | Land | Improvement |
|---|---|---|---|---|
| 2024 | $4,601 | $154,000 | $15,700 | $138,300 |
| 2023 | $4,601 | $140,000 | $15,700 | $124,300 |
| 2022 | $5,869 | $138,200 | $7,700 | $130,500 |
| 2021 | $5,363 | $115,200 | $7,000 | $108,200 |
| 2020 | $5,524 | $112,900 | $7,000 | $105,900 |
| 2019 | $3,263 | $99,200 | $7,000 | $92,200 |
| 2018 | $3,263 | $95,800 | $7,400 | $88,400 |
| 2017 | $4,859 | $95,800 | $7,400 | $88,400 |
| 2016 | $6,541 | $105,000 | $7,400 | $97,600 |
| 2015 | -- | $105,000 | $7,400 | $97,600 |
| 2014 | -- | $103,000 | $7,400 | $95,600 |
Source: Public Records
Map
Nearby Homes
- 411 Liberty St
- 282 Grand St
- 208 Montgomery St
- 333 Liberty St
- 197 Chambers St
- 188 Chambers St
- 193 Chambers St
- 6 Leroy Place
- 350 N Water St Unit 1-2
- 255 Powell Ave
- 253 Powell Ave
- 251 Powell Ave
- 211 N Miller St
- 225 Dubois St
- 159 Grand St
- 299 Liberty St
- 172 Chambers St
- 298 Liberty St Unit 3
- 22 City Terrace N
- 171 Chambers St
- 412 Liberty St
- 416 Liberty St
- 400 Liberty St
- 297 Grand St
- 401 Liberty St Unit 2
- 401 Liberty St
- 396 Liberty St
- 87 Broad St
- 394 Liberty St
- 317 Grand St
- 397 Liberty St
- 397 Liberty St Unit 2
- 392 Liberty St
- 333 Grand St
- 388 Liberty St
- 428 Liberty St Unit B-North
- 428 Liberty St Unit 2
- 428 Liberty St Unit 1
- 428 Liberty St
- 384 Liberty St