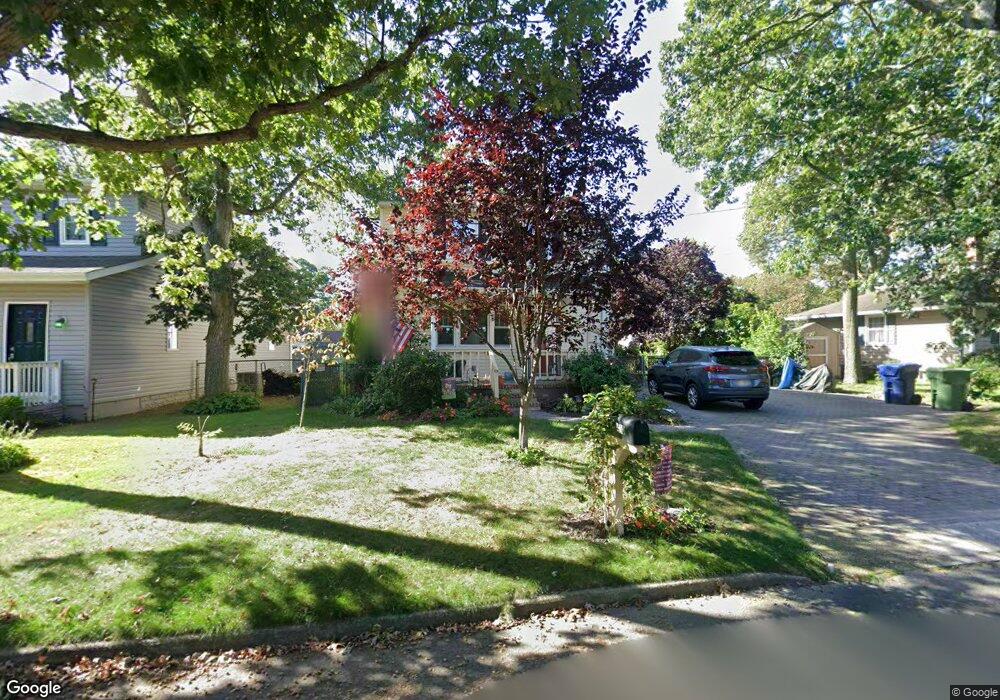
410 Morrisey Rd Neptune, NJ 07753
Estimated Value: $567,000 - $614,000
2
Beds
2
Baths
1,364
Sq Ft
$436/Sq Ft
Est. Value
About This Home
This home is located at 410 Morrisey Rd, Neptune, NJ 07753 and is currently estimated at $595,087, approximately $436 per square foot. 410 Morrisey Rd is a home located in Monmouth County with nearby schools including Neptune High School.
Ownership History
Date
Name
Owned For
Owner Type
Purchase Details
Closed on
Sep 22, 2021
Sold by
Keegan Janice W and Estate Of James Keegan
Bought by
Keegan Janice W and Keegan Janice
Current Estimated Value
Home Financials for this Owner
Home Financials are based on the most recent Mortgage that was taken out on this home.
Original Mortgage
$186,300
Outstanding Balance
$169,519
Interest Rate
2.8%
Mortgage Type
New Conventional
Estimated Equity
$425,568
Purchase Details
Closed on
Apr 13, 2009
Sold by
Rhinehardt Quitman O and Rhinehardt Holly Robbins
Bought by
Keegan James
Home Financials for this Owner
Home Financials are based on the most recent Mortgage that was taken out on this home.
Original Mortgage
$230,000
Interest Rate
4.83%
Mortgage Type
Purchase Money Mortgage
Create a Home Valuation Report for This Property
The Home Valuation Report is an in-depth analysis detailing your home's value as well as a comparison with similar homes in the area
Home Values in the Area
Average Home Value in this Area
Purchase History
| Date | Buyer | Sale Price | Title Company |
|---|---|---|---|
| Keegan Janice W | -- | Wfg National Title Ins Co | |
| Keegan Janice W | -- | Wfg National Title | |
| Keegan James | $288,000 | Multiple |
Source: Public Records
Mortgage History
| Date | Status | Borrower | Loan Amount |
|---|---|---|---|
| Open | Keegan Janice W | $186,300 | |
| Open | Keegan Janice W | $1,863,000 | |
| Previous Owner | Keegan James | $230,000 |
Source: Public Records
Tax History Compared to Growth
Tax History
| Year | Tax Paid | Tax Assessment Tax Assessment Total Assessment is a certain percentage of the fair market value that is determined by local assessors to be the total taxable value of land and additions on the property. | Land | Improvement |
|---|---|---|---|---|
| 2025 | $7,999 | $478,700 | $323,100 | $155,600 |
| 2024 | $7,202 | $456,800 | $304,100 | $152,700 |
| 2023 | $7,202 | $398,800 | $249,600 | $149,200 |
| 2022 | $7,315 | $367,500 | $212,800 | $154,700 |
| 2021 | $6,757 | $346,200 | $227,700 | $118,500 |
| 2020 | $7,017 | $331,300 | $219,000 | $112,300 |
| 2019 | $6,757 | $315,000 | $209,700 | $105,300 |
| 2018 | $6,291 | $289,900 | $185,400 | $104,500 |
| 2017 | $6,246 | $276,500 | $179,700 | $96,800 |
| 2016 | $6,057 | $267,400 | $172,200 | $95,200 |
| 2015 | $5,543 | $248,900 | $156,000 | $92,900 |
| 2014 | $5,120 | $189,000 | $106,000 | $83,000 |
Source: Public Records
Map
Nearby Homes
- 302 Helen Terrace
- 216 Ivins Rd
- 208 Ivins Rd
- 341 Victor Place
- 419 Prospect Ave
- 607 S Riverside Dr
- 724 S Riverside Dr
- 2 Park Place
- 113 Fairview Place
- 200 Melrose Ave
- 107 Melrose Ave
- 111 Prospect Ave
- 1 Oak Dr
- 3005 Alicia Dr
- 12 Tucker Dr
- 1000 Corlies Ave
- 220 W Sylvania Ave Unit 25
- 107 Riverview Ave Unit 121C
- 107 Riverview Ave Unit 113B
- 1305 Squirrel Rd