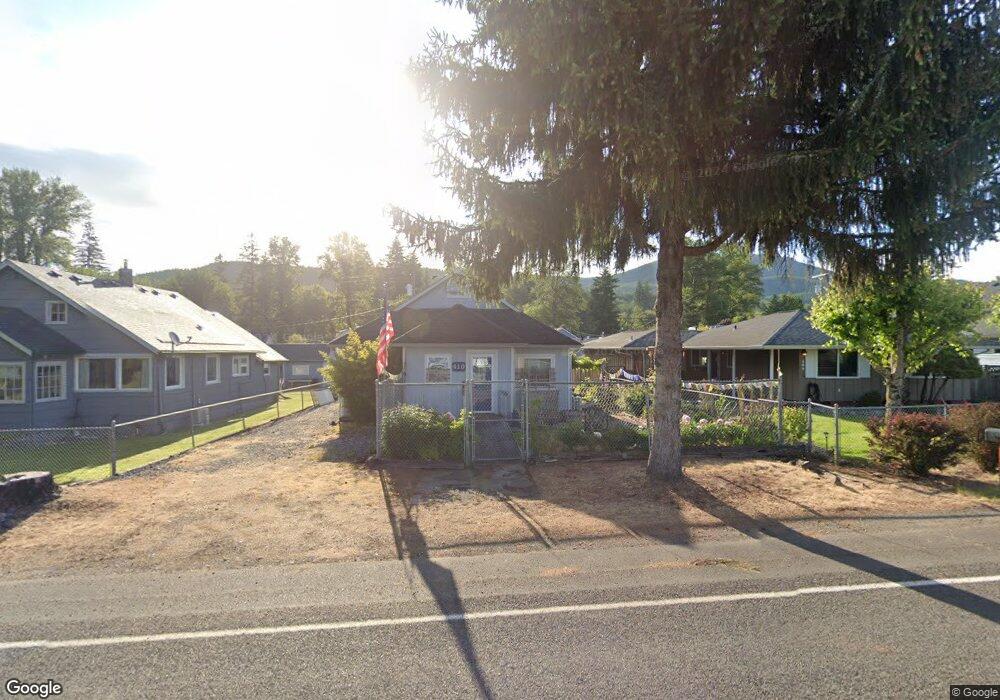
410 Morse St Ryderwood, WA 98581
Ryderwood NeighborhoodEstimated Value: $187,000 - $241,473
2
Beds
1
Bath
840
Sq Ft
$264/Sq Ft
Est. Value
About This Home
This home is located at 410 Morse St, Ryderwood, WA 98581 and is currently estimated at $221,618, approximately $263 per square foot. 410 Morse St is a home located in Cowlitz County with nearby schools including Castle Rock Elementary School, Castle Rock Middle School, and Castle Rock High School.
Ownership History
Date
Name
Owned For
Owner Type
Purchase Details
Closed on
Mar 25, 2011
Sold by
Campbell Claude L
Bought by
Mckim Betty M
Current Estimated Value
Home Financials for this Owner
Home Financials are based on the most recent Mortgage that was taken out on this home.
Original Mortgage
$77,600
Outstanding Balance
$53,744
Interest Rate
4.96%
Mortgage Type
New Conventional
Estimated Equity
$167,874
Purchase Details
Closed on
May 23, 2008
Sold by
Bunch Donald R and Bunch Ellen B
Bought by
Mckim Betty M and Campbell Claude L
Home Financials for this Owner
Home Financials are based on the most recent Mortgage that was taken out on this home.
Original Mortgage
$84,000
Interest Rate
5.87%
Mortgage Type
Purchase Money Mortgage
Create a Home Valuation Report for This Property
The Home Valuation Report is an in-depth analysis detailing your home's value as well as a comparison with similar homes in the area
Home Values in the Area
Average Home Value in this Area
Purchase History
| Date | Buyer | Sale Price | Title Company |
|---|---|---|---|
| Mckim Betty M | $49,677 | Cascade | |
| Mckim Betty M | $105,000 | Stewart Title |
Source: Public Records
Mortgage History
| Date | Status | Borrower | Loan Amount |
|---|---|---|---|
| Open | Mckim Betty M | $77,600 | |
| Previous Owner | Mckim Betty M | $84,000 |
Source: Public Records
Tax History Compared to Growth
Tax History
| Year | Tax Paid | Tax Assessment Tax Assessment Total Assessment is a certain percentage of the fair market value that is determined by local assessors to be the total taxable value of land and additions on the property. | Land | Improvement |
|---|---|---|---|---|
| 2024 | $191 | $31,980 | -- | $31,980 |
| 2023 | $165 | $31,980 | $0 | $31,980 |
| 2022 | $184 | $31,980 | $0 | $31,980 |
| 2021 | $197 | $31,980 | $0 | $31,980 |
| 2020 | $205 | $144,870 | $17,750 | $127,120 |
| 2019 | $145 | $115,928 | $16,900 | $99,028 |
| 2018 | $109 | $80,670 | $16,880 | $63,790 |
| 2017 | $75 | $74,570 | $16,080 | $58,490 |
| 2016 | $72 | $69,140 | $16,080 | $53,060 |
| 2015 | $147 | $69,140 | $16,080 | $53,060 |
| 2013 | -- | $71,040 | $17,290 | $53,750 |
Source: Public Records
Map
Nearby Homes