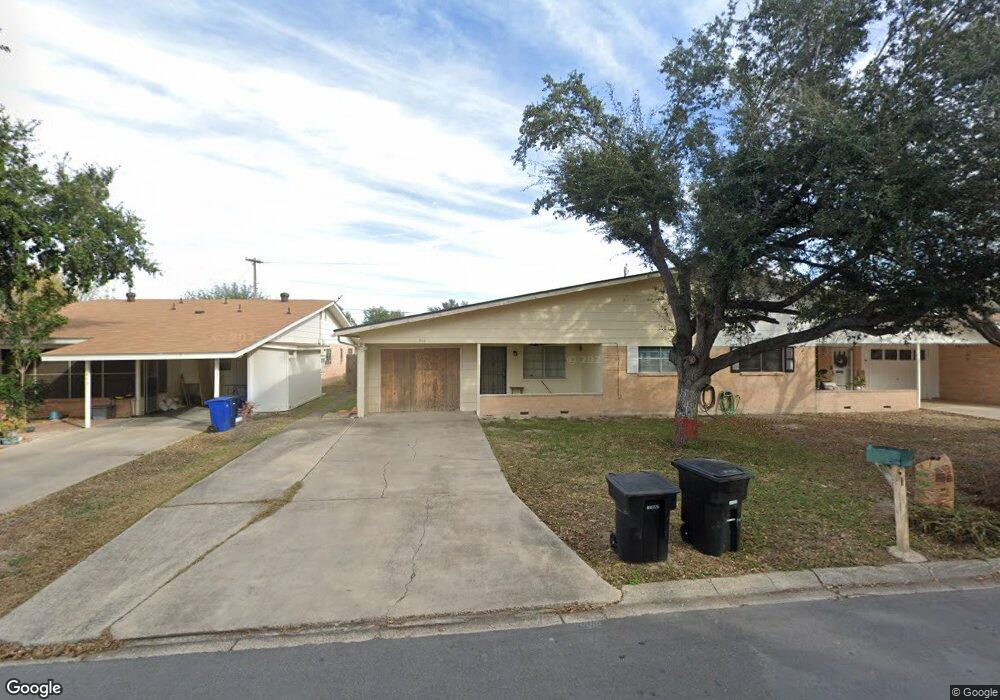
410 N 41st St McAllen, TX 78501
Estimated Value: $128,000 - $145,000
2
Beds
2
Baths
1,277
Sq Ft
$108/Sq Ft
Est. Value
About This Home
This home is located at 410 N 41st St, McAllen, TX 78501 and is currently estimated at $138,272, approximately $108 per square foot. 410 N 41st St is a home located in Hidalgo County with nearby schools including Alvarez Elementary School, De Leon Middle School, and Rowe High School.
Ownership History
Date
Name
Owned For
Owner Type
Purchase Details
Closed on
Oct 29, 2020
Sold by
Losoya Kristopher Michael and Losoya Mary
Bought by
Losoya Kristopher Michael
Current Estimated Value
Home Financials for this Owner
Home Financials are based on the most recent Mortgage that was taken out on this home.
Original Mortgage
$64,000
Outstanding Balance
$56,951
Interest Rate
2.8%
Mortgage Type
New Conventional
Estimated Equity
$81,321
Purchase Details
Closed on
Apr 6, 2018
Sold by
Giraldo Eugenia
Bought by
Losoya Michael
Purchase Details
Closed on
May 20, 2016
Sold by
Giraldo Sherry Trudy
Bought by
Losoya Kristopher Michael
Purchase Details
Closed on
Feb 21, 1997
Sold by
Penalosa Rafael G Gabriel G Penalosa
Bought by
Giraldo Herman and Giraldo Gertrudes A
Home Financials for this Owner
Home Financials are based on the most recent Mortgage that was taken out on this home.
Original Mortgage
$45,399
Interest Rate
7.88%
Mortgage Type
FHA
Create a Home Valuation Report for This Property
The Home Valuation Report is an in-depth analysis detailing your home's value as well as a comparison with similar homes in the area
Home Values in the Area
Average Home Value in this Area
Purchase History
| Date | Buyer | Sale Price | Title Company |
|---|---|---|---|
| Losoya Kristopher Michael | -- | San Jacinto Ttl Svcs Mcallen | |
| Losoya Michael | -- | None Available | |
| Losoya Kristopher Michael | -- | Edwards Abstract | |
| Giraldo Herman | -- | -- |
Source: Public Records
Mortgage History
| Date | Status | Borrower | Loan Amount |
|---|---|---|---|
| Open | Losoya Kristopher Michael | $64,000 | |
| Previous Owner | Giraldo Herman | $45,399 |
Source: Public Records
Tax History Compared to Growth
Tax History
| Year | Tax Paid | Tax Assessment Tax Assessment Total Assessment is a certain percentage of the fair market value that is determined by local assessors to be the total taxable value of land and additions on the property. | Land | Improvement |
|---|---|---|---|---|
| 2025 | $2,300 | $123,733 | $48,675 | $75,058 |
| 2024 | $2,300 | $98,069 | $41,250 | $56,819 |
| 2023 | $2,307 | $98,069 | $41,250 | $56,819 |
| 2022 | $2,313 | $93,286 | $41,250 | $52,036 |
| 2021 | $2,185 | $85,527 | $41,250 | $44,277 |
| 2020 | $2,216 | $86,873 | $41,250 | $45,623 |
| 2019 | $2,238 | $88,221 | $41,250 | $46,971 |
| 2018 | $1,492 | $58,709 | $16,500 | $42,209 |
| 2017 | $1,497 | $58,709 | $16,500 | $42,209 |
| 2016 | $1,497 | $58,709 | $16,500 | $42,209 |
| 2015 | $782 | $58,265 | $16,500 | $41,765 |
Source: Public Records
Map
Nearby Homes
- 411 N 41st St Unit 2
- 401 N 41st St Unit 16
- 313 N 40th St
- 405 N 39th St
- 4000 Eucaliptus Ave
- 517 N 41st Ct
- 3905 Fir Ave
- 325 N 36th Ln
- 4316 Date Palm Ave
- 512 N Ware Rd
- 4212 Gumwood Cir
- 500 N 36th St
- 506 N 36th St
- 1003 N 40th Ln
- 3801 W Us Highway Business 83 Hwy W
- 600 N 35th St
- 912 N Bentsen Rd
- 3517 Us Highway Business 83
- 736 N 46th St
- 4701 Date Palm Ave