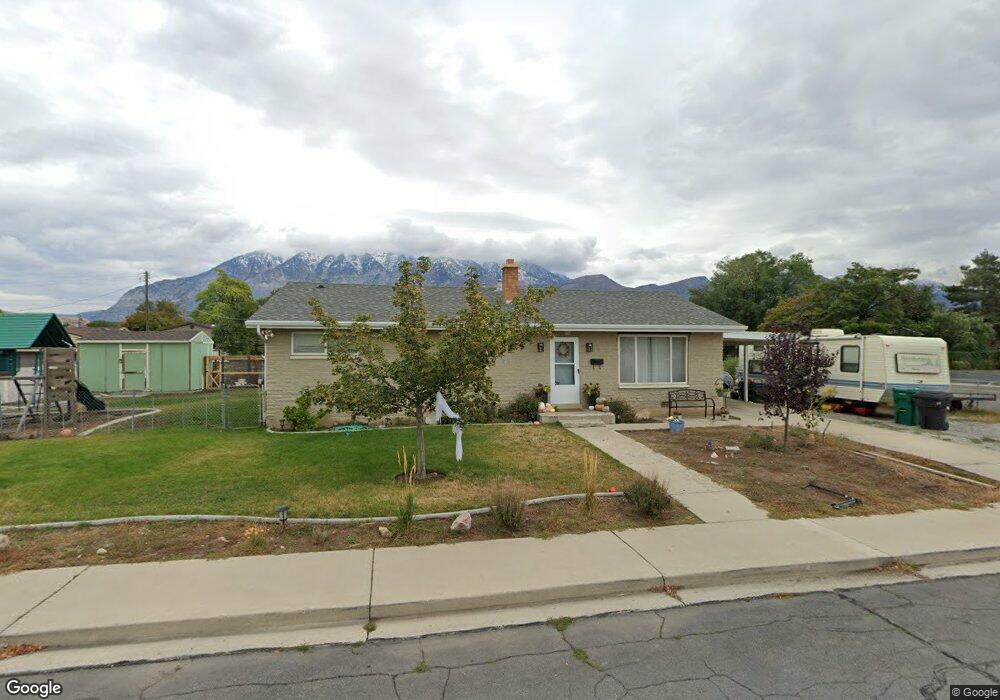
410 N 450 E Orem, UT 84097
Orchard South NeighborhoodEstimated Value: $393,000 - $441,000
3
Beds
2
Baths
1,260
Sq Ft
$335/Sq Ft
Est. Value
About This Home
This home is located at 410 N 450 E, Orem, UT 84097 and is currently estimated at $422,656, approximately $335 per square foot. 410 N 450 E is a home located in Utah County with nearby schools including Cascade Elementary School, Canyon View Junior High School, and Orem High School.
Ownership History
Date
Name
Owned For
Owner Type
Purchase Details
Closed on
May 23, 2011
Sold by
Prentice Desmond
Bought by
Mcbride Bronson
Current Estimated Value
Home Financials for this Owner
Home Financials are based on the most recent Mortgage that was taken out on this home.
Original Mortgage
$130,505
Outstanding Balance
$89,304
Interest Rate
4.55%
Mortgage Type
FHA
Estimated Equity
$333,352
Purchase Details
Closed on
Nov 9, 2004
Sold by
Reno Daniel J and Reno Karen A
Bought by
Prentice Desmond
Home Financials for this Owner
Home Financials are based on the most recent Mortgage that was taken out on this home.
Original Mortgage
$118,061
Interest Rate
5.7%
Mortgage Type
FHA
Purchase Details
Closed on
Aug 20, 2002
Sold by
Bartholomew Ralph B and Bartholomew Linda S
Bought by
Reno Daniel J and Reno Karen A
Home Financials for this Owner
Home Financials are based on the most recent Mortgage that was taken out on this home.
Original Mortgage
$107,043
Interest Rate
6.52%
Mortgage Type
FHA
Create a Home Valuation Report for This Property
The Home Valuation Report is an in-depth analysis detailing your home's value as well as a comparison with similar homes in the area
Home Values in the Area
Average Home Value in this Area
Purchase History
| Date | Buyer | Sale Price | Title Company |
|---|---|---|---|
| Mcbride Bronson | -- | Inwest Title Services Inc | |
| Prentice Desmond | -- | Provo Land Title Co | |
| Reno Daniel J | -- | Horizon Title |
Source: Public Records
Mortgage History
| Date | Status | Borrower | Loan Amount |
|---|---|---|---|
| Open | Mcbride Bronson | $130,505 | |
| Previous Owner | Prentice Desmond | $118,061 | |
| Previous Owner | Reno Daniel J | $107,043 | |
| Closed | Prentice Desmond | $2,750 |
Source: Public Records
Tax History
| Year | Tax Paid | Tax Assessment Tax Assessment Total Assessment is a certain percentage of the fair market value that is determined by local assessors to be the total taxable value of land and additions on the property. | Land | Improvement |
|---|---|---|---|---|
| 2025 | $1,561 | $209,110 | -- | -- |
| 2024 | $1,561 | $190,905 | $0 | $0 |
| 2023 | $1,409 | $185,185 | $0 | $0 |
| 2022 | $1,539 | $195,910 | $0 | $0 |
| 2021 | $1,409 | $271,800 | $143,400 | $128,400 |
| 2020 | $1,269 | $240,600 | $114,700 | $125,900 |
| 2019 | $1,184 | $233,400 | $107,500 | $125,900 |
| 2018 | $1,133 | $213,400 | $103,900 | $109,500 |
| 2017 | $1,042 | $105,105 | $0 | $0 |
| 2016 | $944 | $87,780 | $0 | $0 |
| 2015 | $890 | $78,320 | $0 | $0 |
| 2014 | $879 | $77,000 | $0 | $0 |
Source: Public Records
Map
Nearby Homes
Your Personal Tour Guide
Ask me questions while you tour the home.