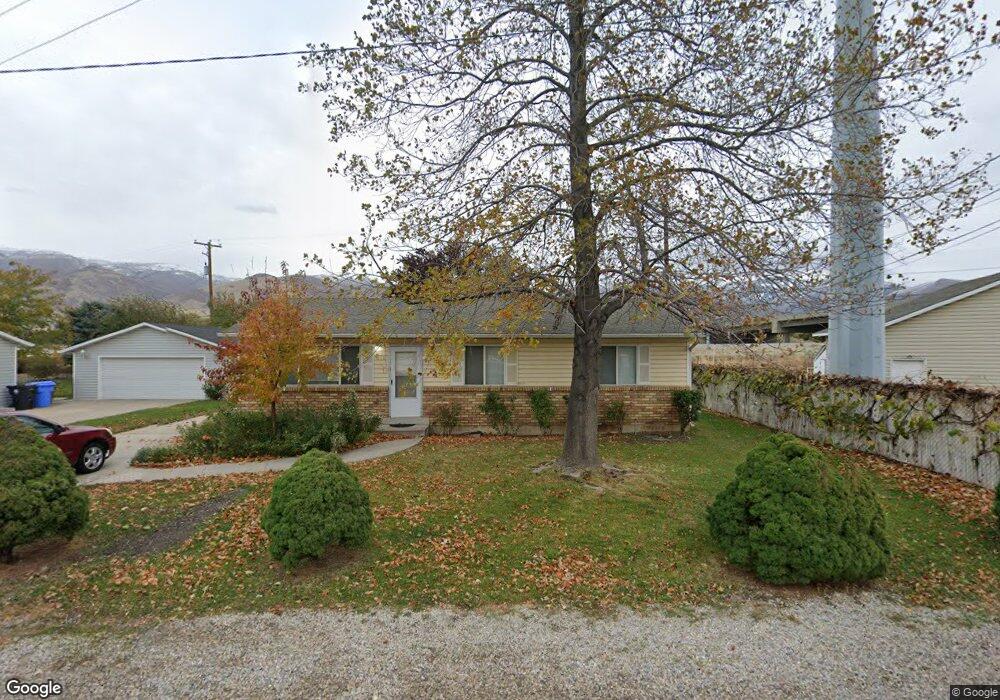
410 N 660 W West Bountiful, UT 84087
Estimated Value: $468,249 - $473,000
2
Beds
1
Bath
1,100
Sq Ft
$428/Sq Ft
Est. Value
About This Home
This home is located at 410 N 660 W, West Bountiful, UT 84087 and is currently estimated at $470,562, approximately $427 per square foot. 410 N 660 W is a home located in Davis County with nearby schools including West Bountiful Elementary School, Bountiful Junior High School, and Viewmont High School.
Ownership History
Date
Name
Owned For
Owner Type
Purchase Details
Closed on
Aug 30, 2000
Sold by
Thornton Richard and Thornton Janice
Bought by
Winkel Hendrik L
Current Estimated Value
Home Financials for this Owner
Home Financials are based on the most recent Mortgage that was taken out on this home.
Original Mortgage
$96,000
Interest Rate
7.93%
Purchase Details
Closed on
Sep 12, 1997
Sold by
Thornton Richard
Bought by
Thornton Richard and Thornton Janice
Home Financials for this Owner
Home Financials are based on the most recent Mortgage that was taken out on this home.
Original Mortgage
$96,075
Interest Rate
7.34%
Purchase Details
Closed on
Sep 11, 1997
Sold by
Thornton Janice L
Bought by
Thornton Richard
Home Financials for this Owner
Home Financials are based on the most recent Mortgage that was taken out on this home.
Original Mortgage
$96,075
Interest Rate
7.34%
Create a Home Valuation Report for This Property
The Home Valuation Report is an in-depth analysis detailing your home's value as well as a comparison with similar homes in the area
Home Values in the Area
Average Home Value in this Area
Purchase History
| Date | Buyer | Sale Price | Title Company |
|---|---|---|---|
| Winkel Hendrik L | -- | Associated Title Company | |
| Thornton Richard | -- | Associated Title Company | |
| Thornton Richard | -- | Associated Title Company |
Source: Public Records
Mortgage History
| Date | Status | Borrower | Loan Amount |
|---|---|---|---|
| Closed | Winkel Hendrik L | $96,000 | |
| Previous Owner | Thornton Richard | $96,075 |
Source: Public Records
Tax History Compared to Growth
Tax History
| Year | Tax Paid | Tax Assessment Tax Assessment Total Assessment is a certain percentage of the fair market value that is determined by local assessors to be the total taxable value of land and additions on the property. | Land | Improvement |
|---|---|---|---|---|
| 2025 | $2,429 | $203,500 | $115,895 | $87,605 |
| 2024 | $2,309 | $199,099 | $95,747 | $103,352 |
| 2023 | $2,215 | $193,600 | $97,889 | $95,711 |
| 2022 | $2,240 | $363,000 | $159,787 | $203,213 |
| 2021 | $2,050 | $280,000 | $123,365 | $156,635 |
| 2020 | $1,820 | $245,000 | $110,674 | $134,326 |
| 2019 | $1,823 | $244,000 | $108,742 | $135,258 |
| 2018 | $1,651 | $217,000 | $104,532 | $112,468 |
| 2016 | $1,493 | $107,745 | $37,342 | $70,403 |
| 2015 | $1,393 | $95,700 | $37,342 | $58,358 |
| 2014 | $1,327 | $94,030 | $37,342 | $56,688 |
| 2013 | -- | $100,650 | $35,995 | $64,655 |
Source: Public Records
Map
Nearby Homes
- 340 N 500 W Unit 204
- 767 W 220 N
- 790 N 500 W
- 399 W 400 N Unit 47
- 366 W 1000 N
- 499 N 200 W Unit 30
- 499 N 200 W Unit 19
- 680 W 500 S Unit 22
- 680 W 500 S Unit 17
- 155 N Peregrine Ln W
- 314 W Center St Unit D135
- 314 W Center St Unit D159
- 314 W Center St Unit E150
- 553 N 200 W
- 167 S 425 W
- 75 N Peregrine Ln W Unit 8
- 131 W 25 N Unit 4
- 147 W 25 N Unit 5
- 825 W 1320 N
- 184 Park Shadows Cir