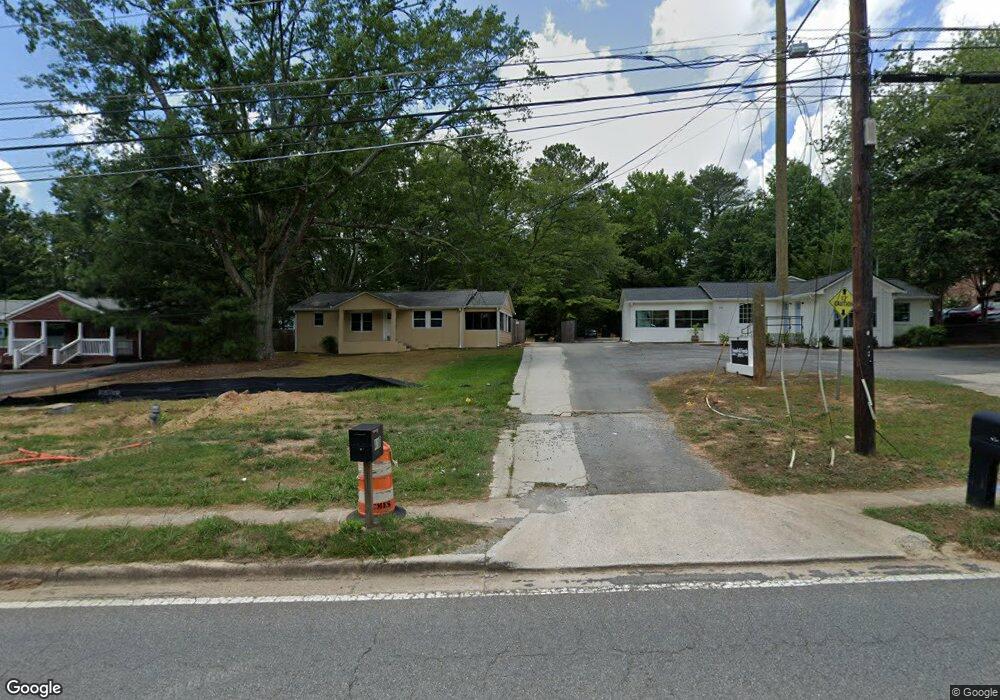
410 N Main St Alpharetta, GA 30009
Estimated Value: $740,000 - $3,495,000
2
Beds
1
Bath
912
Sq Ft
$1,761/Sq Ft
Est. Value
About This Home
This home is located at 410 N Main St, Alpharetta, GA 30009 and is currently estimated at $1,606,230, approximately $1,761 per square foot. 410 N Main St is a home with nearby schools including Alpharetta Elementary School, Hopewell Middle School, and Cambridge High School.
Ownership History
Date
Name
Owned For
Owner Type
Purchase Details
Closed on
May 28, 2013
Sold by
Bank Of Atlanta
Bought by
Vishal I Llc
Current Estimated Value
Home Financials for this Owner
Home Financials are based on the most recent Mortgage that was taken out on this home.
Original Mortgage
$227,500
Outstanding Balance
$160,962
Interest Rate
3.37%
Mortgage Type
New Conventional
Estimated Equity
$1,445,268
Purchase Details
Closed on
Apr 3, 2012
Sold by
Bank Of Atlanta
Bought by
Bank Of Atlanta
Purchase Details
Closed on
May 31, 2007
Sold by
Sedehi Mohammad
Bought by
Imani Environmental Group Inc
Home Financials for this Owner
Home Financials are based on the most recent Mortgage that was taken out on this home.
Original Mortgage
$616,000
Interest Rate
6.12%
Mortgage Type
New Conventional
Create a Home Valuation Report for This Property
The Home Valuation Report is an in-depth analysis detailing your home's value as well as a comparison with similar homes in the area
Home Values in the Area
Average Home Value in this Area
Purchase History
| Date | Buyer | Sale Price | Title Company |
|---|---|---|---|
| Vishal I Llc | $325,000 | -- | |
| Bank Of Atlanta | $423,000 | -- | |
| Imani Environmental Group Inc | $3,375,000 | -- |
Source: Public Records
Mortgage History
| Date | Status | Borrower | Loan Amount |
|---|---|---|---|
| Open | Vishal I Llc | $227,500 | |
| Previous Owner | Imani Environmental Group Inc | $616,000 |
Source: Public Records
Tax History Compared to Growth
Tax History
| Year | Tax Paid | Tax Assessment Tax Assessment Total Assessment is a certain percentage of the fair market value that is determined by local assessors to be the total taxable value of land and additions on the property. | Land | Improvement |
|---|---|---|---|---|
| 2025 | $1,550 | $269,600 | $55,800 | $213,800 |
| 2023 | $1,550 | $269,600 | $55,800 | $213,800 |
| 2022 | $7,875 | $250,600 | $194,800 | $55,800 |
| 2021 | $690 | $220,440 | $175,640 | $44,800 |
| 2020 | $3,733 | $238,600 | $201,680 | $36,920 |
| 2019 | $640 | $111,280 | $70,600 | $40,680 |
| 2018 | $3,068 | $108,680 | $68,960 | $39,720 |
| 2017 | $1,364 | $46,760 | $39,560 | $7,200 |
| 2016 | $1,365 | $46,760 | $39,560 | $7,200 |
| 2015 | $1,639 | $46,760 | $39,560 | $7,200 |
| 2014 | $1,433 | $46,760 | $39,560 | $7,200 |
Source: Public Records
Map
Nearby Homes
- 150 Shady Grove Ln
- 2632 Vintage Dr Unit 9
- 2644 Vintage Dr
- 264 N Main St
- 1045 Winthrope Chase Dr
- 141 North Trace
- 254 N Main St
- 326 Andover Dr
- 193 Jere Dr
- 5610 Surrey Ct
- 115 Baxley Ln
- 320 Shady Grove Ln
- 295 Pebble Trail
- 265 Mayfield Rd
- 410 Anglin Walk
- 1085 Pine Grove Dr
- 250 Mayfield Rd
- 320 Jayne Ellen Way Unit 3
- 260 Mayfield Rd
- 400 N Main St
- 418 N Main St
- 401 Canton St
- 393 Canton St
- 480 N Main St Unit 216
- 480 N Main St Unit 214
- 480 N Main St
- 380 N Main St
- 381a Canton St
- 105 Pebble Trail
- 1095 Winthrope Park Dr
- 1105 Winthrope Park Dr
- 1085 Winthrope Park Dr
- 371 Canton St Unit B
- 371 Canton St
- 100 Pebble Trail
- 1075 Winthrope Park Dr
- 115 Pebble Trail
- 7100 Surrey Point