Estimated Value: $212,870 - $278,000
--
Bed
--
Bath
1,972
Sq Ft
$122/Sq Ft
Est. Value
About This Home
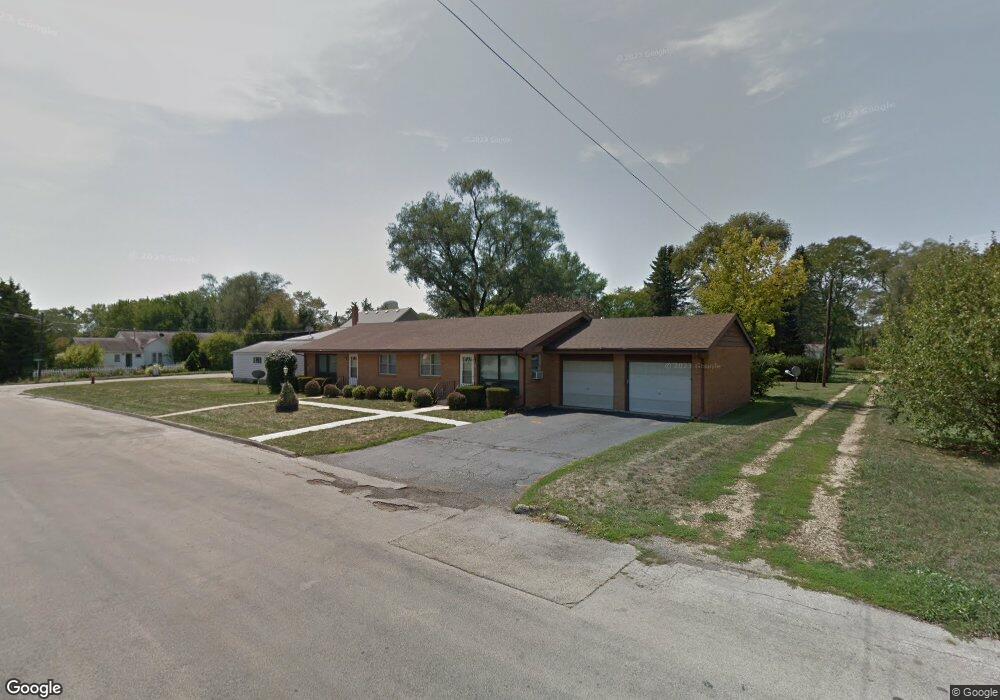
This home is located at 410 N Mineral St, Byron, IL 61010 and is currently estimated at $241,218, approximately $122 per square foot. 410 N Mineral St is a home located in Ogle County with nearby schools including Mary Morgan Elementary School, Byron Middle School, and Byron High School.
Ownership History
Date
Name
Owned For
Owner Type
Purchase Details
Closed on
Aug 27, 2025
Sold by
Alan L Wetzel Trust and Anne L Wetzel Trust
Bought by
Luepkes Austin
Current Estimated Value
Home Financials for this Owner
Home Financials are based on the most recent Mortgage that was taken out on this home.
Original Mortgage
$210,000
Outstanding Balance
$210,000
Interest Rate
6.74%
Mortgage Type
New Conventional
Estimated Equity
$31,218
Purchase Details
Closed on
Jun 30, 2020
Sold by
Wetzel Alan L and Anne Lowetzel
Bought by
Alan L Wetzel Trust
Purchase Details
Closed on
Nov 26, 2013
Sold by
Sunset Prairie Llc
Bought by
Wetzel Alan L and Wetzel Anne L
Home Financials for this Owner
Home Financials are based on the most recent Mortgage that was taken out on this home.
Original Mortgage
$95,000
Interest Rate
4.75%
Mortgage Type
FHA
Purchase Details
Closed on
Apr 24, 2009
Sold by
The Old Second National Bank Of Aurora
Bought by
Love Amy E
Purchase Details
Closed on
Apr 27, 2006
Sold by
Love Amy We
Bought by
The Old Seond National Ban Of Aurora
Create a Home Valuation Report for This Property
The Home Valuation Report is an in-depth analysis detailing your home's value as well as a comparison with similar homes in the area
Home Values in the Area
Average Home Value in this Area
Purchase History
| Date | Buyer | Sale Price | Title Company |
|---|---|---|---|
| Luepkes Austin | $280,000 | Ko | |
| Alan L Wetzel Trust | -- | None Available | |
| Wetzel Alan L | $127,900 | None Available | |
| Love Amy E | -- | None Available | |
| The Old Seond National Ban Of Aurora | -- | None Available |
Source: Public Records
Mortgage History
| Date | Status | Borrower | Loan Amount |
|---|---|---|---|
| Open | Luepkes Austin | $210,000 | |
| Previous Owner | Wetzel Alan L | $95,000 |
Source: Public Records
Tax History Compared to Growth
Tax History
| Year | Tax Paid | Tax Assessment Tax Assessment Total Assessment is a certain percentage of the fair market value that is determined by local assessors to be the total taxable value of land and additions on the property. | Land | Improvement |
|---|---|---|---|---|
| 2024 | $4,938 | $57,913 | $4,300 | $53,613 |
| 2023 | $4,642 | $55,056 | $4,088 | $50,968 |
| 2022 | $4,378 | $51,058 | $3,791 | $47,267 |
| 2021 | $4,317 | $48,878 | $3,629 | $45,249 |
| 2020 | $3,981 | $47,920 | $3,558 | $44,362 |
| 2019 | $3,995 | $46,412 | $3,446 | $42,966 |
| 2018 | $3,997 | $45,214 | $3,357 | $41,857 |
| 2017 | $3,955 | $45,214 | $3,357 | $41,857 |
| 2016 | $3,719 | $44,384 | $3,295 | $41,089 |
| 2015 | $3,542 | $42,966 | $3,190 | $39,776 |
| 2014 | $2,887 | $42,966 | $3,190 | $39,776 |
| 2013 | $2,972 | $35,931 | $3,231 | $32,700 |
Source: Public Records
Map
Nearby Homes
- 429 N Union St
- 521 N Walnut St
- 1269 E Kysor Rd
- 401 W 3rd St
- 00 E Ashelford Dr Unit LOT 8
- 00 E Ashelford Dr
- 423 W 4th St
- 8890 Hales Corner Rd Rd
- 4934 E Ashelford Dr
- 503 W 2nd St
- 309 Creekside Dr
- 265 Creekside Dr
- 0 N Kishwaukee Rd Lot Unit WP001
- 5166 E Hubbard Trail
- 5304 E Hubbard Trail
- 8692 Glacier Dr
- 815 Hampton Dr
- 1245 Glacier Dr
- 1257 Glacier Dr
- 1368 Joanne Terrace
- 408 N Mineral St
- 416 E 4th St
- 507 All Saints Dr
- 432 E 5th St
- 000 N Mineral St
- 403 N Mineral St
- 422 E 5th St
- 417 N Mineral St
- 401 N Mineral St
- 409 E 4th St
- 431 N Mineral St
- 432 E 4th St
- 337 N Mineral St
- 417 N Peru St
- 435 N Mineral St
- 410 E 5th St
- 522 All Saints Dr
- 521 All Saints Dr
- 331 N Mineral St
- 407 E 4th St