Estimated Value: $198,000 - $250,000
4
Beds
2
Baths
1,596
Sq Ft
$137/Sq Ft
Est. Value
About This Home
This home is located at 410 N West St, Xenia, OH 45385 and is currently estimated at $218,411, approximately $136 per square foot. 410 N West St is a home located in Greene County with nearby schools including Xenia High School, Summit Academy Community School for Alternative Learners - Xenia, and Legacy Christian Academy.
Ownership History
Date
Name
Owned For
Owner Type
Purchase Details
Closed on
Oct 9, 2020
Sold by
Norris David W and Norris Trisha
Bought by
Lusk Jonathan Forrest and Lusk Theresa Rose
Current Estimated Value
Home Financials for this Owner
Home Financials are based on the most recent Mortgage that was taken out on this home.
Original Mortgage
$123,500
Outstanding Balance
$109,847
Interest Rate
2.9%
Mortgage Type
New Conventional
Estimated Equity
$108,564
Purchase Details
Closed on
Mar 8, 2006
Sold by
Finley Gayle M
Bought by
Norris David W and Norris Trisha
Home Financials for this Owner
Home Financials are based on the most recent Mortgage that was taken out on this home.
Original Mortgage
$67,900
Interest Rate
6.33%
Mortgage Type
Fannie Mae Freddie Mac
Purchase Details
Closed on
Feb 24, 2004
Sold by
Estate Of Glenn R Finley
Bought by
Finley Gayle M
Create a Home Valuation Report for This Property
The Home Valuation Report is an in-depth analysis detailing your home's value as well as a comparison with similar homes in the area
Home Values in the Area
Average Home Value in this Area
Purchase History
| Date | Buyer | Sale Price | Title Company |
|---|---|---|---|
| Lusk Jonathan Forrest | $130,000 | Vantage Land Title | |
| Norris David W | $84,900 | None Available | |
| Finley Gayle M | -- | -- |
Source: Public Records
Mortgage History
| Date | Status | Borrower | Loan Amount |
|---|---|---|---|
| Open | Lusk Jonathan Forrest | $123,500 | |
| Previous Owner | Norris David W | $67,900 |
Source: Public Records
Tax History Compared to Growth
Tax History
| Year | Tax Paid | Tax Assessment Tax Assessment Total Assessment is a certain percentage of the fair market value that is determined by local assessors to be the total taxable value of land and additions on the property. | Land | Improvement |
|---|---|---|---|---|
| 2024 | $2,433 | $56,850 | $6,870 | $49,980 |
| 2023 | $2,433 | $56,850 | $6,870 | $49,980 |
| 2022 | $2,080 | $41,470 | $4,290 | $37,180 |
| 2021 | $2,108 | $34,440 | $4,290 | $30,150 |
| 2020 | $1,634 | $34,440 | $4,290 | $30,150 |
| 2019 | $1,552 | $30,790 | $3,190 | $27,600 |
| 2018 | $1,558 | $30,790 | $3,190 | $27,600 |
| 2017 | $1,512 | $30,790 | $3,190 | $27,600 |
| 2016 | $1,518 | $29,450 | $3,190 | $26,260 |
| 2015 | $1,522 | $29,450 | $3,190 | $26,260 |
| 2014 | $1,456 | $29,450 | $3,190 | $26,260 |
Source: Public Records
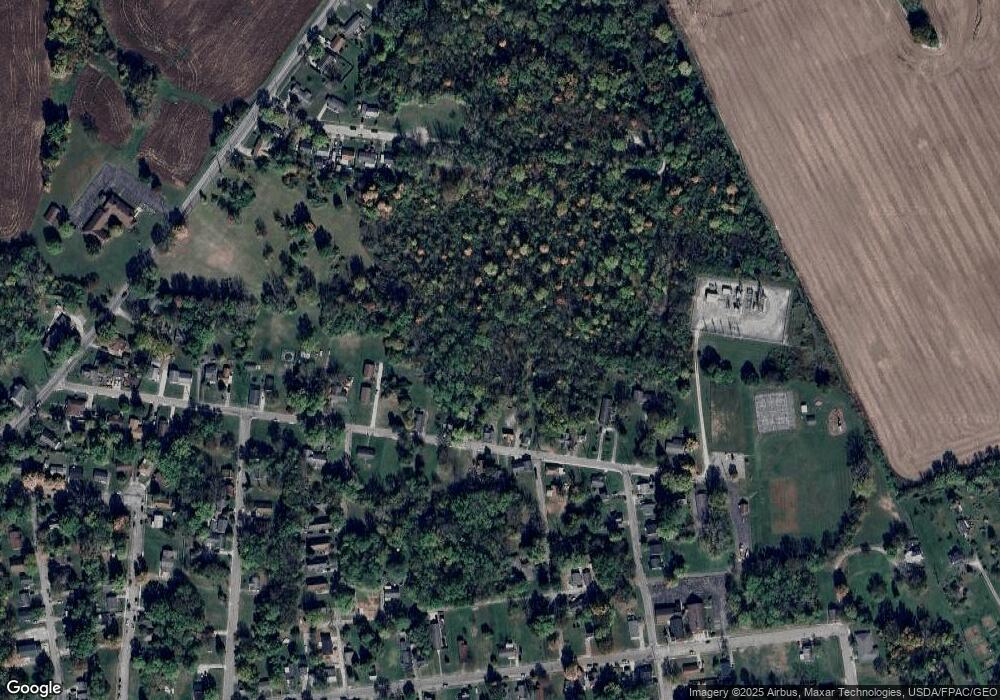
Map
Nearby Homes