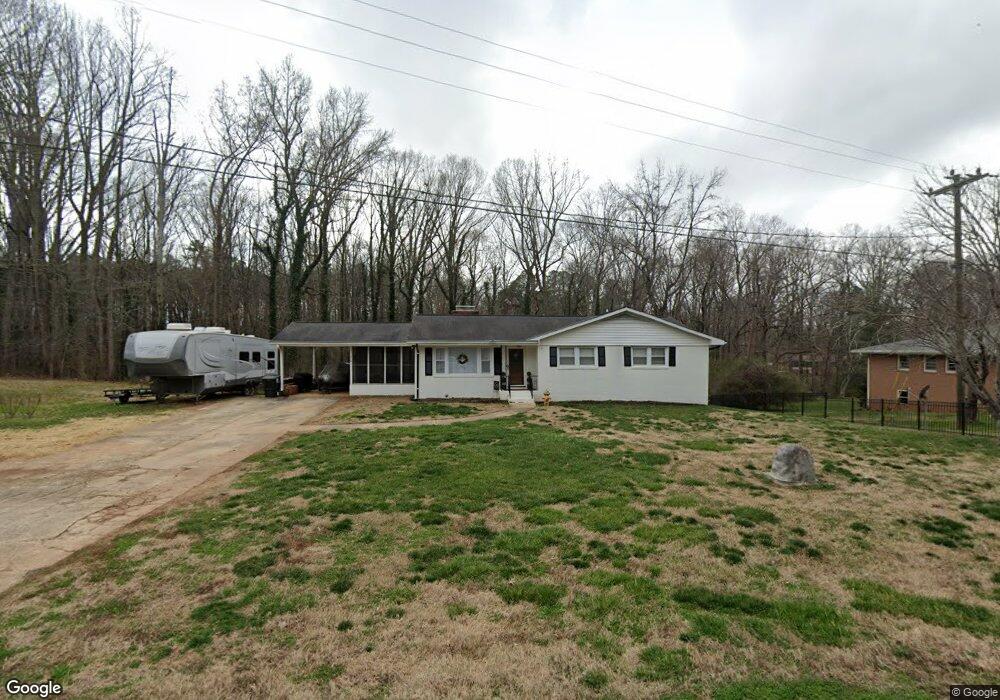
410 Neel Rd Salisbury, NC 28147
Estimated Value: $315,000 - $346,860
--
Bed
2
Baths
2,177
Sq Ft
$153/Sq Ft
Est. Value
About This Home
This home is located at 410 Neel Rd, Salisbury, NC 28147 and is currently estimated at $333,465, approximately $153 per square foot. 410 Neel Rd is a home located in Rowan County with nearby schools including Hurley Elementary School, West Rowan Middle School, and West Rowan High School.
Ownership History
Date
Name
Owned For
Owner Type
Purchase Details
Closed on
Feb 10, 2022
Sold by
Hall Matthew Lyman and Hall Melanie Clark
Bought by
Abue Thomas Howard
Current Estimated Value
Home Financials for this Owner
Home Financials are based on the most recent Mortgage that was taken out on this home.
Original Mortgage
$282,828
Outstanding Balance
$262,627
Interest Rate
3.55%
Mortgage Type
New Conventional
Estimated Equity
$70,838
Purchase Details
Closed on
Aug 25, 2020
Sold by
Capps Gary Wayne
Bought by
Hall Matthew and Hall Melanie
Home Financials for this Owner
Home Financials are based on the most recent Mortgage that was taken out on this home.
Original Mortgage
$153,000
Interest Rate
3%
Mortgage Type
New Conventional
Purchase Details
Closed on
Jul 13, 2007
Sold by
Evans Howard C and Evans Joyce P
Bought by
Capps Gary Wayne
Home Financials for this Owner
Home Financials are based on the most recent Mortgage that was taken out on this home.
Original Mortgage
$126,900
Interest Rate
6.37%
Mortgage Type
Purchase Money Mortgage
Create a Home Valuation Report for This Property
The Home Valuation Report is an in-depth analysis detailing your home's value as well as a comparison with similar homes in the area
Home Values in the Area
Average Home Value in this Area
Purchase History
| Date | Buyer | Sale Price | Title Company |
|---|---|---|---|
| Abue Thomas Howard | $280,000 | Overbey Jon | |
| Abue Thomas Howard | $280,000 | Overbey Jon | |
| Hall Matthew | $153,000 | None Available | |
| Capps Gary Wayne | $146,000 | None Available |
Source: Public Records
Mortgage History
| Date | Status | Borrower | Loan Amount |
|---|---|---|---|
| Open | Abue Thomas Howard | $282,828 | |
| Closed | Abue Thomas Howard | $282,828 | |
| Previous Owner | Hall Matthew | $153,000 | |
| Previous Owner | Capps Gary Wayne | $126,900 |
Source: Public Records
Tax History Compared to Growth
Tax History
| Year | Tax Paid | Tax Assessment Tax Assessment Total Assessment is a certain percentage of the fair market value that is determined by local assessors to be the total taxable value of land and additions on the property. | Land | Improvement |
|---|---|---|---|---|
| 2025 | $1,913 | $282,303 | $34,000 | $248,303 |
| 2024 | $1,913 | $282,303 | $34,000 | $248,303 |
| 2023 | $1,913 | $282,303 | $34,000 | $248,303 |
| 2022 | $1,223 | $161,936 | $28,500 | $133,436 |
| 2021 | $1,210 | $161,936 | $28,500 | $133,436 |
| 2020 | $1,210 | $161,936 | $28,500 | $133,436 |
| 2019 | $1,210 | $161,936 | $28,500 | $133,436 |
| 2018 | $1,037 | $139,842 | $28,500 | $111,342 |
| 2017 | $1,037 | $139,842 | $28,500 | $111,342 |
| 2016 | $1,037 | $139,842 | $28,500 | $111,342 |
| 2015 | $1,051 | $139,842 | $28,500 | $111,342 |
| 2014 | $1,035 | $144,795 | $28,500 | $116,295 |
Source: Public Records
Map
Nearby Homes
- 335 Neel Rd
- 415 Autumnlight Dr
- 135 Devon Dr
- 617 Autumnlight Dr
- 290 Roger Dr
- 1380 Julius Dr
- 280 Bonaventure Dr
- 202 Windmill Rd
- 325 Bonaventure Dr
- 0 Windmill Rd
- 1445 Julius Dr
- 2885 Wright Ave
- 260 Cameron Dr
- 4710 Mooresville Rd
- 4712 Mooresville Rd
- 3.24 AC Sherrills Ford Rd
- 308 Hickory Ln
- 325 Bob White Run
- 240 Partridge Run
- 0 Bradshaw Rd