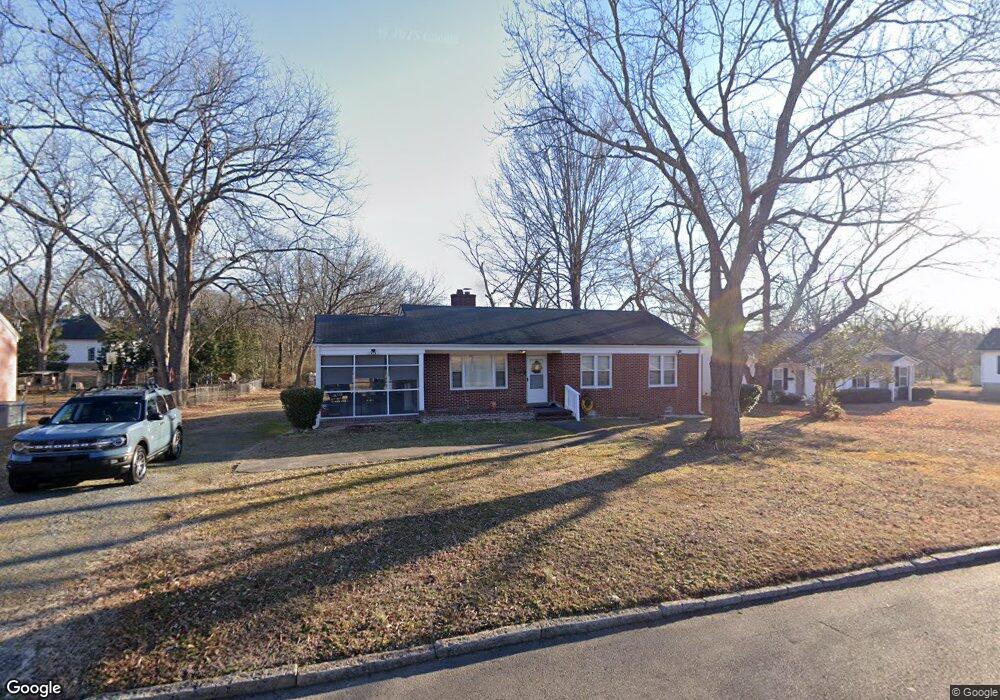
410 New College St Oxford, NC 27565
Estimated Value: $62,000 - $237,000
3
Beds
1
Bath
1,119
Sq Ft
$155/Sq Ft
Est. Value
About This Home
This home is located at 410 New College St, Oxford, NC 27565 and is currently estimated at $173,472, approximately $155 per square foot. 410 New College St is a home located in Granville County with nearby schools including Stovall-Shaw Elementary School, Northern Granville Middle School, and Hill City High School.
Ownership History
Date
Name
Owned For
Owner Type
Purchase Details
Closed on
Apr 3, 2009
Sold by
Tunstall William L and Tunstall Wilma B
Bought by
Manning Kenneth R and Manning June L
Current Estimated Value
Home Financials for this Owner
Home Financials are based on the most recent Mortgage that was taken out on this home.
Original Mortgage
$114,750
Outstanding Balance
$73,161
Interest Rate
5.1%
Mortgage Type
Credit Line Revolving
Estimated Equity
$100,311
Create a Home Valuation Report for This Property
The Home Valuation Report is an in-depth analysis detailing your home's value as well as a comparison with similar homes in the area
Home Values in the Area
Average Home Value in this Area
Purchase History
| Date | Buyer | Sale Price | Title Company |
|---|---|---|---|
| Manning Kenneth R | $125,000 | -- |
Source: Public Records
Mortgage History
| Date | Status | Borrower | Loan Amount |
|---|---|---|---|
| Open | Manning Kenneth R | $114,750 |
Source: Public Records
Tax History Compared to Growth
Tax History
| Year | Tax Paid | Tax Assessment Tax Assessment Total Assessment is a certain percentage of the fair market value that is determined by local assessors to be the total taxable value of land and additions on the property. | Land | Improvement |
|---|---|---|---|---|
| 2025 | $1,628 | $137,124 | $15,000 | $122,124 |
| 2024 | $1,628 | $137,124 | $15,000 | $122,124 |
| 2023 | $1,626 | $88,542 | $14,000 | $74,542 |
| 2022 | $1,335 | $88,542 | $14,000 | $74,542 |
| 2021 | $1,330 | $88,542 | $14,000 | $74,542 |
| 2020 | $1,330 | $88,542 | $14,000 | $74,542 |
| 2019 | $1,330 | $88,542 | $14,000 | $74,542 |
| 2018 | $1,330 | $88,542 | $14,000 | $74,542 |
| 2016 | $1,252 | $81,070 | $14,000 | $67,070 |
| 2015 | $1,207 | $81,070 | $14,000 | $67,070 |
| 2014 | $1,207 | $81,070 | $14,000 | $67,070 |
| 2013 | -- | $81,070 | $14,000 | $67,070 |
Source: Public Records
Map
Nearby Homes