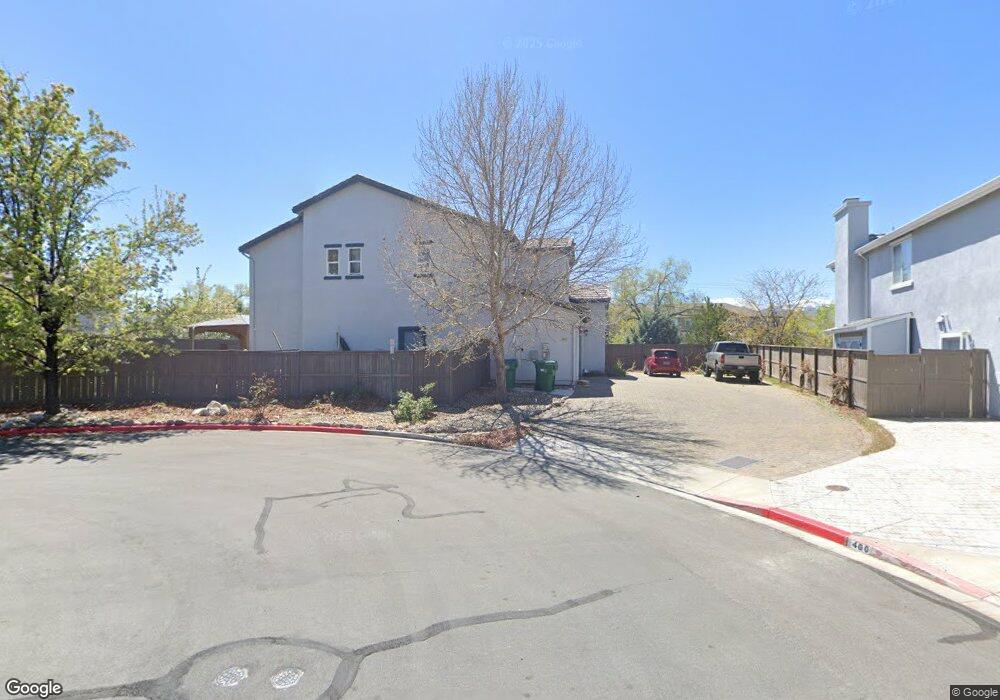
410 Parade Ct Reno, NV 89521
Virginia Foothills NeighborhoodEstimated Value: $819,594 - $874,000
5
Beds
3
Baths
3,193
Sq Ft
$268/Sq Ft
Est. Value
About This Home
This home is located at 410 Parade Ct, Reno, NV 89521 and is currently estimated at $856,399, approximately $268 per square foot. 410 Parade Ct is a home located in Washoe County with nearby schools including Brown Elementary School, Marce Herz Middle School, and Galena High School.
Ownership History
Date
Name
Owned For
Owner Type
Purchase Details
Closed on
Oct 12, 2021
Sold by
Jacobsen Vanessa
Bought by
Delvalle Frank and Delvalle Cynthia
Current Estimated Value
Home Financials for this Owner
Home Financials are based on the most recent Mortgage that was taken out on this home.
Original Mortgage
$390,000
Outstanding Balance
$355,644
Interest Rate
2.8%
Mortgage Type
New Conventional
Estimated Equity
$500,755
Purchase Details
Closed on
Aug 9, 2006
Sold by
Lennar Reno Llc
Bought by
Jacobsen Damon and Jacobsen Vanessa
Home Financials for this Owner
Home Financials are based on the most recent Mortgage that was taken out on this home.
Original Mortgage
$438,212
Interest Rate
2.45%
Mortgage Type
Negative Amortization
Create a Home Valuation Report for This Property
The Home Valuation Report is an in-depth analysis detailing your home's value as well as a comparison with similar homes in the area
Home Values in the Area
Average Home Value in this Area
Purchase History
| Date | Buyer | Sale Price | Title Company |
|---|---|---|---|
| Delvalle Frank | -- | Ticor Title Reno | |
| Jacobsen Vanessa | -- | Ticor Title Reno | |
| Jacobsen Damon | $548,000 | North American Title Co |
Source: Public Records
Mortgage History
| Date | Status | Borrower | Loan Amount |
|---|---|---|---|
| Open | Delvalle Frank | $390,000 | |
| Closed | Jacobsen Damon | $438,212 |
Source: Public Records
Tax History Compared to Growth
Tax History
| Year | Tax Paid | Tax Assessment Tax Assessment Total Assessment is a certain percentage of the fair market value that is determined by local assessors to be the total taxable value of land and additions on the property. | Land | Improvement |
|---|---|---|---|---|
| 2025 | $4,573 | $184,080 | $43,092 | $140,988 |
| 2024 | $4,573 | $178,155 | $36,320 | $141,835 |
| 2023 | $3,325 | $175,091 | $41,202 | $133,889 |
| 2022 | $4,310 | $146,083 | $34,808 | $111,276 |
| 2021 | $4,186 | $136,150 | $25,673 | $110,477 |
| 2020 | $3,936 | $136,242 | $25,767 | $110,475 |
| 2019 | $3,750 | $132,669 | $24,759 | $107,910 |
| 2018 | $3,578 | $123,294 | $18,491 | $104,803 |
| 2017 | $3,434 | $122,267 | $17,420 | $104,847 |
| 2016 | $3,347 | $122,990 | $15,908 | $107,082 |
| 2015 | $3,341 | $122,011 | $15,561 | $106,450 |
| 2014 | $3,244 | $107,542 | $13,640 | $93,902 |
| 2013 | -- | $85,895 | $11,072 | $74,823 |
Source: Public Records
Map
Nearby Homes
- 530 Alydar Ct
- 590 Secretariat Ct Unit 5
- 645 Paso Fino Ct
- 490 Miesque Ct Unit 6
- 597 Connemaras Ct
- 11325 Messina Ct
- 280 Pisces Cir
- 11135 Messina Way
- 16260 Rhyolite Cir
- 2210 Paint Horse Dr
- 12104 Blacktail Ct
- 11204 Freedom Range Ln
- 255 Zircon Dr
- 2944 Ruby Desert Dr
- 14505 Geronimo Trail
- 2904 Amethyst Hills Dr
- 2982 Saddle Peak Dr
- 0 Cinder Ln Unit 250001294
- 0 Geiger Grade Unit 250053963
- 0 Us Hwy 395 S Unit 240002170
- 400 Parade Ct
- 14015 Traveler Ct
- 14005 Traveler Ct
- 401 Parade Ct
- 415 Parade Ct
- 405 Parade Ct
- 425 Parade Ct Unit 8
- 14000 Traveler Ct
- 420 Shire Ct
- 410 Shire Ct
- 14010 Traveler Ct Unit 8
- 435 Parade Ct Unit 8
- 14020 Traveler Ct
- 430 Shire Ct
- 445 Parade Ct
- 14001 Welsh Mountain Ct
- 14011 Welsh Mountain Ct
- 14021 Welsh Mountain Ct
- 440 Shire Ct
- 421 Shire Ct