Estimated Value: $346,000 - $549,000
2
Beds
1
Bath
1,000
Sq Ft
$468/Sq Ft
Est. Value
About This Home
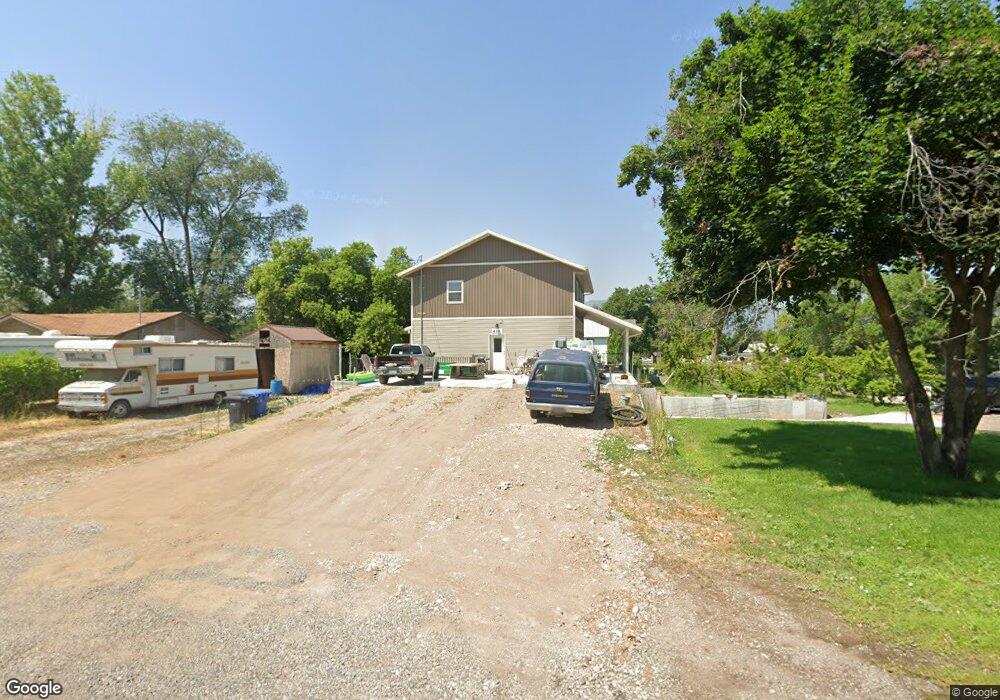
This home is located at 410 S 100 E, Hyrum, UT 84319 and is currently estimated at $468,069, approximately $468 per square foot. 410 S 100 E is a home located in Cache County with nearby schools including Canyon School, South Cache Middle School, and Mountain Crest High School.
Ownership History
Date
Name
Owned For
Owner Type
Purchase Details
Closed on
Sep 20, 2016
Sold by
Crookston Nicholas J
Bought by
Crookston Nicholas J and Crookston Madi S S
Current Estimated Value
Home Financials for this Owner
Home Financials are based on the most recent Mortgage that was taken out on this home.
Original Mortgage
$178,400
Outstanding Balance
$142,112
Interest Rate
3.43%
Mortgage Type
New Conventional
Estimated Equity
$325,957
Purchase Details
Closed on
May 1, 2013
Sold by
Wasatch Peaks Credit Union
Bought by
Crookston Nicholas J
Purchase Details
Closed on
May 5, 2010
Sold by
James Beau C and Estate Of Chris Clair James
Bought by
James Beau C
Purchase Details
Closed on
Oct 17, 2006
Sold by
The Family Trust Of A Clair & Carolyn J
Bought by
James Chris Clair
Create a Home Valuation Report for This Property
The Home Valuation Report is an in-depth analysis detailing your home's value as well as a comparison with similar homes in the area
Home Values in the Area
Average Home Value in this Area
Purchase History
| Date | Buyer | Sale Price | Title Company |
|---|---|---|---|
| Crookston Nicholas J | -- | Hickman Land Title Company | |
| Crookston Nicholas J | -- | Hickman Land Title Company | |
| Crookston Nicholas J | -- | Mountain View Title Ogden | |
| James Beau C | -- | None Available | |
| James Chris Clair | -- | None Available |
Source: Public Records
Mortgage History
| Date | Status | Borrower | Loan Amount |
|---|---|---|---|
| Open | Crookston Nicholas J | $178,400 | |
| Closed | Crookston Nicholas J | $178,400 |
Source: Public Records
Tax History Compared to Growth
Tax History
| Year | Tax Paid | Tax Assessment Tax Assessment Total Assessment is a certain percentage of the fair market value that is determined by local assessors to be the total taxable value of land and additions on the property. | Land | Improvement |
|---|---|---|---|---|
| 2025 | $2,084 | $299,260 | $0 | $0 |
| 2024 | $2,220 | $297,705 | $0 | $0 |
| 2023 | $2,205 | $282,730 | $0 | $0 |
| 2022 | $2,301 | $282,730 | $0 | $0 |
| 2021 | $1,732 | $327,820 | $65,050 | $262,770 |
| 2020 | $1,653 | $293,546 | $65,050 | $228,496 |
| 2019 | $1,614 | $269,696 | $41,200 | $228,496 |
| 2018 | $1,518 | $245,215 | $41,200 | $204,015 |
| 2017 | $1,545 | $129,525 | $0 | $0 |
| 2016 | $1,580 | $64,350 | $0 | $0 |
| 2015 | $787 | $64,350 | $0 | $0 |
| 2014 | $568 | $47,470 | $0 | $0 |
| 2013 | $576 | $47,470 | $0 | $0 |
Source: Public Records
Map
Nearby Homes