Estimated Value: $195,000 - $236,000
2
Beds
2
Baths
792
Sq Ft
$276/Sq Ft
Est. Value
About This Home
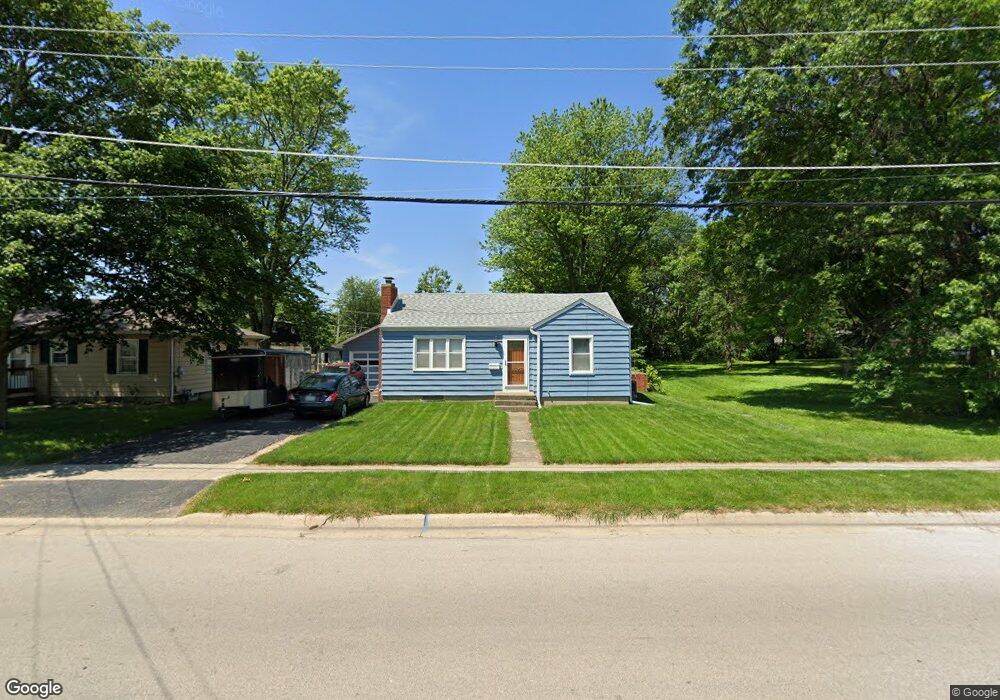
This home is located at 410 S Ben St, Plano, IL 60545 and is currently estimated at $218,402, approximately $275 per square foot. 410 S Ben St is a home located in Kendall County with nearby schools including P.H. Miller Elementary School, Centennial Elementary School, and Emily G. Johns School.
Ownership History
Date
Name
Owned For
Owner Type
Purchase Details
Closed on
Sep 5, 2018
Sold by
Wernsman Brad A
Bought by
Wernsman Brad A and Wernsman Opal
Current Estimated Value
Purchase Details
Closed on
Sep 14, 2017
Sold by
Pasternak John
Bought by
Pasternak John and Pasternak Diane
Purchase Details
Closed on
Dec 28, 2004
Sold by
Pearson Jennie M
Bought by
Pasternak John
Home Financials for this Owner
Home Financials are based on the most recent Mortgage that was taken out on this home.
Original Mortgage
$100,000
Outstanding Balance
$50,589
Interest Rate
5.78%
Mortgage Type
Purchase Money Mortgage
Estimated Equity
$167,813
Purchase Details
Closed on
Mar 26, 1997
Sold by
Gawendra John E and Gawendra Carol L
Bought by
Pearson Jennie M
Home Financials for this Owner
Home Financials are based on the most recent Mortgage that was taken out on this home.
Original Mortgage
$60,000
Interest Rate
7.73%
Purchase Details
Closed on
Jun 1, 1988
Create a Home Valuation Report for This Property
The Home Valuation Report is an in-depth analysis detailing your home's value as well as a comparison with similar homes in the area
Home Values in the Area
Average Home Value in this Area
Purchase History
| Date | Buyer | Sale Price | Title Company |
|---|---|---|---|
| Wernsman Brad A | -- | Attorney | |
| Pasternak John | -- | Attorney | |
| Pasternak John | $135,000 | Multiple | |
| Pearson Jennie M | $90,000 | Law Title Insurance Co | |
| -- | $60,000 | -- |
Source: Public Records
Mortgage History
| Date | Status | Borrower | Loan Amount |
|---|---|---|---|
| Open | Pasternak John | $100,000 | |
| Previous Owner | Pearson Jennie M | $60,000 |
Source: Public Records
Tax History Compared to Growth
Tax History
| Year | Tax Paid | Tax Assessment Tax Assessment Total Assessment is a certain percentage of the fair market value that is determined by local assessors to be the total taxable value of land and additions on the property. | Land | Improvement |
|---|---|---|---|---|
| 2024 | $5,264 | $69,973 | $9,377 | $60,596 |
| 2023 | $4,758 | $62,237 | $8,340 | $53,897 |
| 2022 | $4,758 | $56,786 | $7,610 | $49,176 |
| 2021 | $4,489 | $53,274 | $7,138 | $46,136 |
| 2020 | $4,523 | $52,229 | $6,998 | $45,231 |
| 2019 | $4,465 | $50,625 | $6,711 | $43,914 |
| 2018 | $4,443 | $48,214 | $6,391 | $41,823 |
| 2017 | $4,340 | $44,412 | $6,391 | $38,021 |
| 2016 | $4,072 | $38,612 | $6,391 | $32,221 |
| 2015 | $3,924 | $33,518 | $5,500 | $28,018 |
| 2014 | -- | $30,711 | $5,000 | $25,711 |
| 2013 | -- | $31,177 | $6,266 | $24,911 |
Source: Public Records
Map
Nearby Homes
- 215 W Rock St
- 403 Corri Ln
- 18 W South St
- Lot 1 Blk 12 W John St
- 111 W North St
- 302 N Center St
- 604 W Lee St
- 405 Cooper St
- 508 Ramsden Rd
- 00 Lakewood Springs 7a
- Lot 6 Lakeside
- Lot 1B Lakeside Dr
- 209 Sweetbriar St
- 13811 Hale Rd
- 3860 Drew Ave
- 3810 Drew Ave
- 38 Lynwood Dr
- 16323 Griswold Springs Rd
- 3005 Courtney St
- 3304 Alyssa St Unit 2A