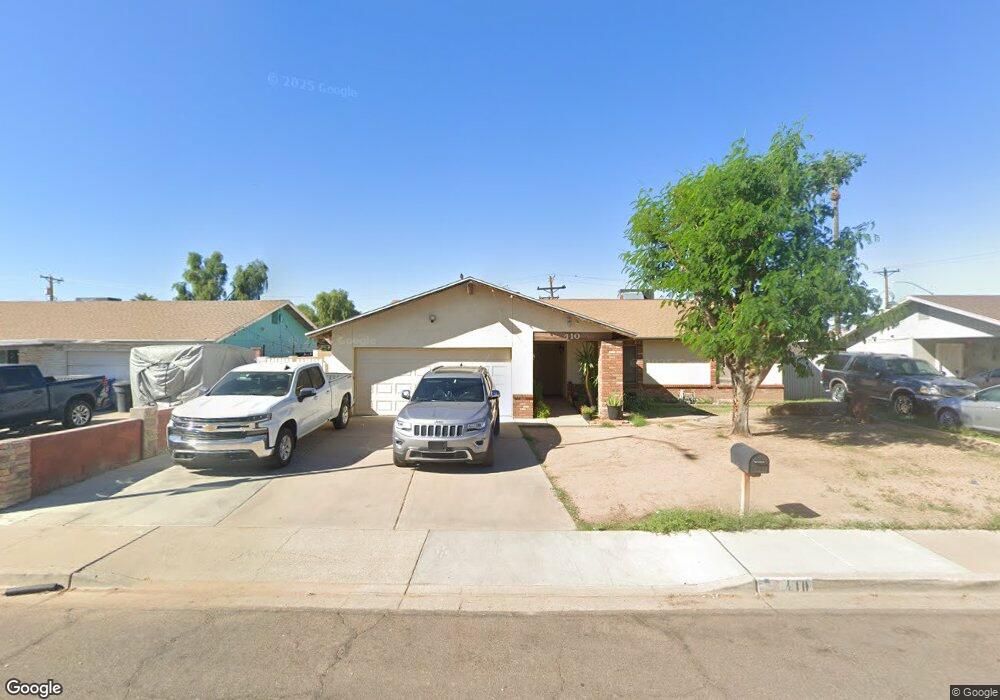
410 S Spur Mesa, AZ 85204
Reed Park NeighborhoodEstimated Value: $356,000 - $402,000
--
Bed
2
Baths
1,645
Sq Ft
$230/Sq Ft
Est. Value
About This Home
This home is located at 410 S Spur, Mesa, AZ 85204 and is currently estimated at $378,861, approximately $230 per square foot. 410 S Spur is a home located in Maricopa County with nearby schools including Lindbergh Elementary School, Franklin at Brimhall Elementary School, and Franklin West Elementary School.
Ownership History
Date
Name
Owned For
Owner Type
Purchase Details
Closed on
Jul 8, 2024
Sold by
Fass Joe J
Bought by
Espinoza Placido and Suarez Lidia
Current Estimated Value
Purchase Details
Closed on
Feb 6, 2007
Sold by
Fass Karen Dale
Bought by
Fass Joe J
Home Financials for this Owner
Home Financials are based on the most recent Mortgage that was taken out on this home.
Original Mortgage
$196,000
Interest Rate
1%
Mortgage Type
New Conventional
Purchase Details
Closed on
Sep 11, 1996
Sold by
Mcgarry Lawrence Kennith and Mcgarry Josephine F
Bought by
Fass Joe J and Fass Karen Dale
Home Financials for this Owner
Home Financials are based on the most recent Mortgage that was taken out on this home.
Original Mortgage
$87,065
Interest Rate
7.88%
Mortgage Type
FHA
Purchase Details
Closed on
Apr 17, 1995
Sold by
Richardson Michael J and Richardson Penny L
Bought by
Mcgarry Lawrence Kennith and Mcgarry Josephine F
Create a Home Valuation Report for This Property
The Home Valuation Report is an in-depth analysis detailing your home's value as well as a comparison with similar homes in the area
Home Values in the Area
Average Home Value in this Area
Purchase History
| Date | Buyer | Sale Price | Title Company |
|---|---|---|---|
| Espinoza Placido | $365,000 | Magnus Title Agency | |
| Fass Joe J | -- | First American Title Ins Co | |
| Fass Joe J | $87,600 | Stewart Title & Trust | |
| Mcgarry Lawrence Kennith | $86,500 | Stewart Title |
Source: Public Records
Mortgage History
| Date | Status | Borrower | Loan Amount |
|---|---|---|---|
| Previous Owner | Fass Joe J | $196,000 | |
| Previous Owner | Fass Joe J | $87,065 |
Source: Public Records
Tax History Compared to Growth
Tax History
| Year | Tax Paid | Tax Assessment Tax Assessment Total Assessment is a certain percentage of the fair market value that is determined by local assessors to be the total taxable value of land and additions on the property. | Land | Improvement |
|---|---|---|---|---|
| 2025 | $1,309 | $13,264 | -- | -- |
| 2024 | $1,114 | $12,632 | -- | -- |
| 2023 | $1,114 | $29,920 | $5,980 | $23,940 |
| 2022 | $1,089 | $23,170 | $4,630 | $18,540 |
| 2021 | $1,119 | $22,020 | $4,400 | $17,620 |
| 2020 | $1,104 | $19,880 | $3,970 | $15,910 |
| 2019 | $1,023 | $18,130 | $3,620 | $14,510 |
| 2018 | $976 | $16,500 | $3,300 | $13,200 |
| 2017 | $946 | $16,960 | $3,390 | $13,570 |
| 2016 | $929 | $16,330 | $3,260 | $13,070 |
| 2015 | $877 | $12,660 | $2,530 | $10,130 |
Source: Public Records
Map
Nearby Homes
- 1432 E Broadway Rd
- 1340 E Crescent Ave
- 211 S Doran
- 1402 E Dana Ave
- 1137 E 5th Ave
- 1132 E Nielson Ave
- 1750 E Mateo Cir Unit 103
- 1521 E Diamond Ave
- 1714 E Dana Ave
- 749 S Lazona Dr
- 1048 E 6th Ave
- 1064 E Dolphin Ave
- 1424 E El Moro Ave
- 62 N Parsell -- N Unit 22
- 955 E Main St
- 135 N Stapley Dr
- 943 S Lazona Dr
- 1655 E 1st Place
- 1953 E Marilyn Ave
- 2014 E Bayberry Ave