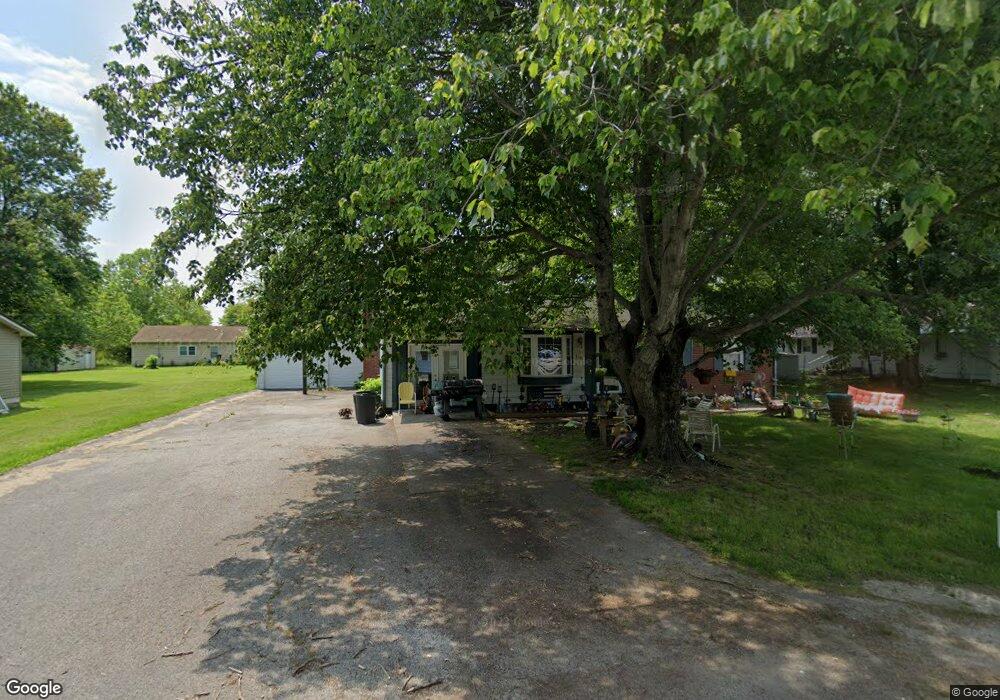
410 S Weir Ln Austin, IN 47102
Estimated Value: $134,000 - $152,000
3
Beds
1
Bath
1,128
Sq Ft
$129/Sq Ft
Est. Value
About This Home
This home is located at 410 S Weir Ln, Austin, IN 47102 and is currently estimated at $145,000, approximately $128 per square foot. 410 S Weir Ln is a home located in Scott County with nearby schools including Austin Elementary School, Austin Middle School, and Austin High School.
Ownership History
Date
Name
Owned For
Owner Type
Purchase Details
Closed on
Nov 27, 2019
Sold by
Bridgestone Properties Llc
Bought by
Southern Indiana Home Properties Llc
Current Estimated Value
Purchase Details
Closed on
Dec 22, 2016
Sold by
Johnson Tammy Stout
Bought by
M & M Investment Group Llc
Create a Home Valuation Report for This Property
The Home Valuation Report is an in-depth analysis detailing your home's value as well as a comparison with similar homes in the area
Home Values in the Area
Average Home Value in this Area
Purchase History
| Date | Buyer | Sale Price | Title Company |
|---|---|---|---|
| Southern Indiana Home Properties Llc | -- | None Available | |
| M & M Investment Group Llc | $23,000 | None Available |
Source: Public Records
Tax History Compared to Growth
Tax History
| Year | Tax Paid | Tax Assessment Tax Assessment Total Assessment is a certain percentage of the fair market value that is determined by local assessors to be the total taxable value of land and additions on the property. | Land | Improvement |
|---|---|---|---|---|
| 2024 | $1,341 | $54,700 | $6,500 | $48,200 |
| 2023 | $1,478 | $55,900 | $6,500 | $49,400 |
| 2022 | $1,221 | $55,300 | $6,500 | $48,800 |
| 2021 | $1,092 | $52,700 | $6,500 | $46,200 |
| 2020 | $1,207 | $45,400 | $6,500 | $38,900 |
| 2019 | $1,320 | $47,500 | $6,500 | $41,000 |
| 2018 | $1,285 | $47,200 | $6,500 | $40,700 |
| 2017 | $1,359 | $47,200 | $6,500 | $40,700 |
| 2016 | $1,198 | $59,600 | $6,500 | $53,100 |
| 2014 | $1,210 | $60,500 | $7,300 | $53,200 |
| 2013 | $1,210 | $61,200 | $7,400 | $53,800 |
Source: Public Records
Map
Nearby Homes