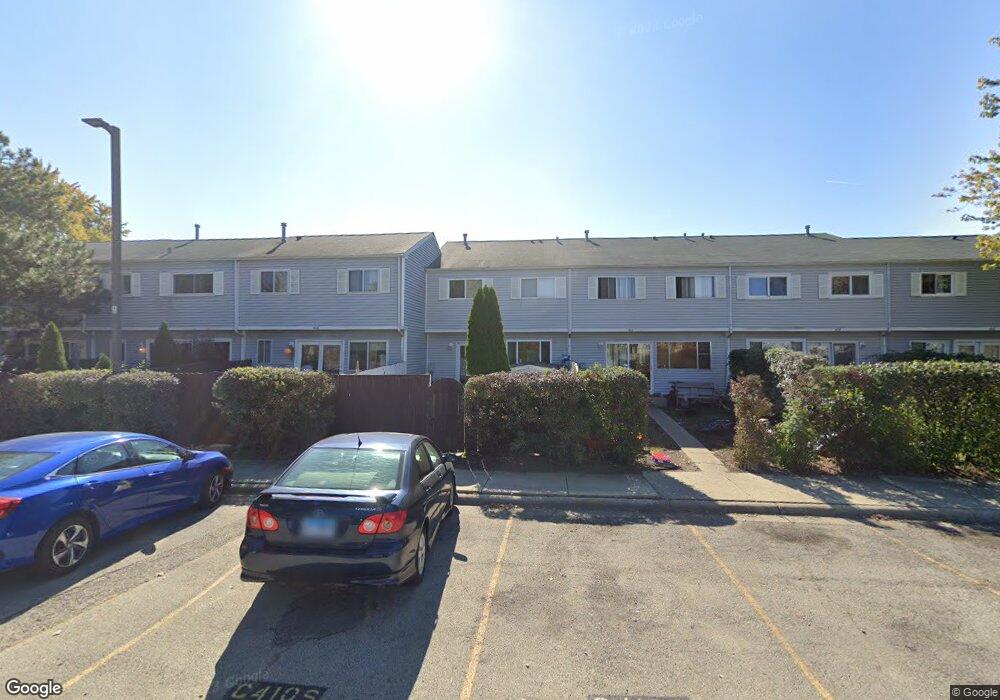
410 Salem Square Bolingbrook, IL 60440
East Bolingbrook NeighborhoodEstimated Value: $216,408 - $228,000
4
Beds
2
Baths
1,224
Sq Ft
$181/Sq Ft
Est. Value
About This Home
This home is located at 410 Salem Square, Bolingbrook, IL 60440 and is currently estimated at $221,352, approximately $180 per square foot. 410 Salem Square is a home located in Will County with nearby schools including Bernard J Ward Elementary School, Brooks Middle School, and Hubert H Humphrey Middle School.
Ownership History
Date
Name
Owned For
Owner Type
Purchase Details
Closed on
Oct 7, 2025
Sold by
Chacon Jose G and Chacon Francisca
Bought by
Chacon Juan
Current Estimated Value
Home Financials for this Owner
Home Financials are based on the most recent Mortgage that was taken out on this home.
Original Mortgage
$213,400
Outstanding Balance
$213,242
Interest Rate
7.5%
Mortgage Type
New Conventional
Estimated Equity
$8,110
Purchase Details
Closed on
Sep 20, 1999
Sold by
Chacon Jose G and Chacon Francisca
Bought by
Chacon Jose G and Chacon Francisca
Home Financials for this Owner
Home Financials are based on the most recent Mortgage that was taken out on this home.
Original Mortgage
$65,600
Interest Rate
8.21%
Purchase Details
Closed on
Jan 10, 1991
Bought by
Chacon Jose Fran
Create a Home Valuation Report for This Property
The Home Valuation Report is an in-depth analysis detailing your home's value as well as a comparison with similar homes in the area
Home Values in the Area
Average Home Value in this Area
Purchase History
| Date | Buyer | Sale Price | Title Company |
|---|---|---|---|
| Chacon Juan | $220,000 | Fidelity National Title | |
| Chacon Jose G | -- | -- | |
| Chacon Jose Fran | $62,000 | -- |
Source: Public Records
Mortgage History
| Date | Status | Borrower | Loan Amount |
|---|---|---|---|
| Open | Chacon Juan | $213,400 | |
| Previous Owner | Chacon Jose G | $65,600 |
Source: Public Records
Tax History
| Year | Tax Paid | Tax Assessment Tax Assessment Total Assessment is a certain percentage of the fair market value that is determined by local assessors to be the total taxable value of land and additions on the property. | Land | Improvement |
|---|---|---|---|---|
| 2024 | $4,045 | $51,794 | $9,058 | $42,736 |
| 2023 | $4,045 | $46,602 | $8,150 | $38,452 |
| 2022 | $3,801 | $39,824 | $6,965 | $32,859 |
| 2021 | $3,035 | $36,151 | $6,322 | $29,829 |
| 2020 | $2,827 | $33,944 | $5,936 | $28,008 |
| 2019 | $2,588 | $31,084 | $5,436 | $25,648 |
| 2018 | $2,180 | $26,988 | $4,720 | $22,268 |
| 2017 | $1,925 | $24,363 | $4,261 | $20,102 |
| 2016 | $1,750 | $22,300 | $3,900 | $18,400 |
| 2015 | $1,554 | $20,000 | $3,500 | $16,500 |
| 2014 | $1,554 | $20,000 | $3,500 | $16,500 |
| 2013 | $1,554 | $22,800 | $4,000 | $18,800 |
Source: Public Records
Map
Nearby Homes
- 401 Salem Square
- 408 Colony Ct Unit 4
- 405 Colony Ct
- 103 Enclave Cir Unit C
- 5 E Fernwood Dr
- 127 Monticello Cir
- 252 S Ashbury Ave
- 10 Fernwood Dr Unit L
- 9 Fernwood Dr Unit Q
- 234 Malibu Dr
- 226 Grant Dr
- 112 Brook Ct
- 372 Windsong Ct Unit 4110
- 124 Seabury Rd
- 220 N Ashbury Ave
- 207 Seabury Rd
- 325 Rockhurst Rd
- 118 Camelot Way
- 153 Camelot Way
- 141 W Robinhood Way Unit 141
- 408 Salem Square
- 406 Salem Square Unit 8
- 404 Salem Square
- 416 Salem Square
- 402 Salem Square Unit 10
- 418 Salem Square
- 400 Salem Square Unit 11
- 420 Salem Square
- 422 Salem Square Unit 14
- 424 Salem Square Unit 13
- 427 Salem Square Unit 1
- 427 Salem Square Unit 427
- 429 Salem Square Unit 2
- 431 Salem Square Unit 3
- 431 Salem Square Unit 431
- 433 Salem Square Unit 4
- 433 Salem Square Unit 6
- 426 Salem Square Unit 12
- 435 Salem Square Unit 5
- 437 Salem Square
Your Personal Tour Guide
Ask me questions while you tour the home.