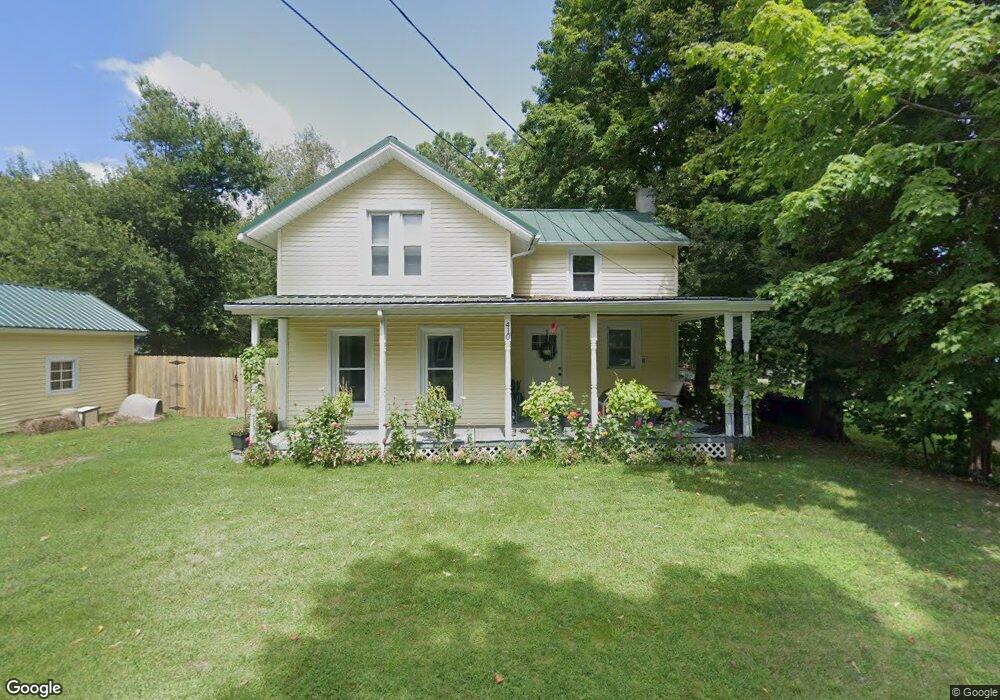
410 Seneca St Jonesville, MI 49250
Estimated Value: $164,981 - $216,000
--
Bed
1
Bath
1,058
Sq Ft
$173/Sq Ft
Est. Value
About This Home
This home is located at 410 Seneca St, Jonesville, MI 49250 and is currently estimated at $183,245, approximately $173 per square foot. 410 Seneca St is a home located in Hillsdale County with nearby schools including Williams Elementary School, Jonesville Middle School, and Jonesville High School.
Ownership History
Date
Name
Owned For
Owner Type
Purchase Details
Closed on
Dec 27, 2017
Sold by
Gordon Julie L
Bought by
Gordon Julie L and Gordon Elizabeth Ashlyn
Current Estimated Value
Home Financials for this Owner
Home Financials are based on the most recent Mortgage that was taken out on this home.
Original Mortgage
$81,000
Outstanding Balance
$70,099
Interest Rate
4.99%
Mortgage Type
Adjustable Rate Mortgage/ARM
Estimated Equity
$113,146
Purchase Details
Closed on
Sep 22, 2004
Sold by
Pressler Erroll K and Pressler Patsy M
Bought by
Gordon Julie L
Home Financials for this Owner
Home Financials are based on the most recent Mortgage that was taken out on this home.
Original Mortgage
$56,465
Interest Rate
5.95%
Mortgage Type
Unknown
Purchase Details
Closed on
Oct 29, 1997
Sold by
Plum Lelah M
Bought by
Pressler Erroll K and Pressler Patsy M
Create a Home Valuation Report for This Property
The Home Valuation Report is an in-depth analysis detailing your home's value as well as a comparison with similar homes in the area
Home Values in the Area
Average Home Value in this Area
Purchase History
| Date | Buyer | Sale Price | Title Company |
|---|---|---|---|
| Gordon Julie L | -- | None Available | |
| Gordon Julie L | $57,000 | -- | |
| Pressler Erroll K | $36,500 | -- |
Source: Public Records
Mortgage History
| Date | Status | Borrower | Loan Amount |
|---|---|---|---|
| Open | Gordon Julie L | $81,000 | |
| Closed | Gordon Julie L | $56,465 |
Source: Public Records
Tax History Compared to Growth
Tax History
| Year | Tax Paid | Tax Assessment Tax Assessment Total Assessment is a certain percentage of the fair market value that is determined by local assessors to be the total taxable value of land and additions on the property. | Land | Improvement |
|---|---|---|---|---|
| 2025 | $1,237 | $52,800 | $0 | $0 |
| 2024 | $757 | $48,500 | $0 | $0 |
| 2023 | $721 | $43,200 | $0 | $0 |
| 2022 | $1,124 | $37,200 | $0 | $0 |
| 2021 | $1,090 | $35,600 | $0 | $0 |
| 2020 | $1,078 | $33,900 | $0 | $0 |
| 2019 | $1,045 | $30,700 | $0 | $0 |
| 2018 | $1,007 | $30,400 | $0 | $0 |
| 2017 | $975 | $29,800 | $0 | $0 |
| 2016 | $966 | $26,560 | $0 | $0 |
| 2015 | $604 | $26,560 | $0 | $0 |
Source: Public Records
Map
Nearby Homes