
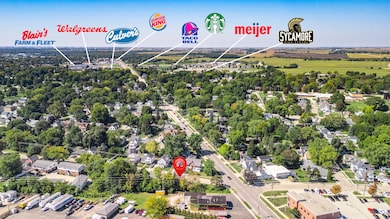
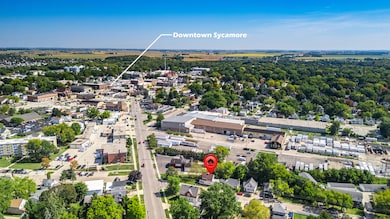
410 Stark Ave Sycamore, IL 60178
Estimated payment $1,508/month
Highlights
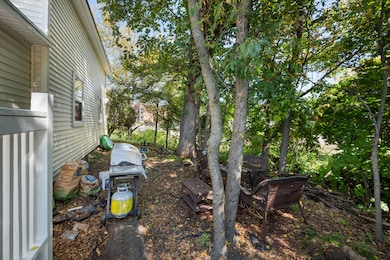
- Mature Trees
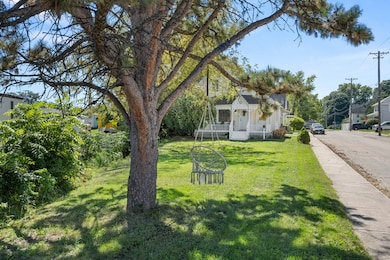
- Corner Lot
- Farmhouse Sink
- Main Floor Bedroom
- Mud Room
- Stainless Steel Appliances
About This Home
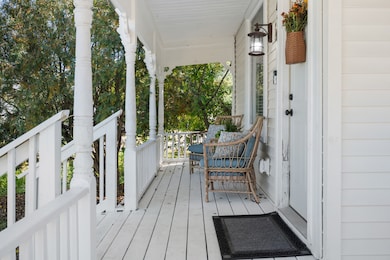
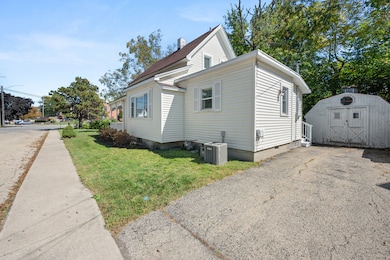
CHARMING AND COZY JUST WAITING FOR YOU! Step onto the welcoming front porch and discover a home that beautifully blends timeless charm with thoughtful updates. This 3-bedroom, 2-bath home offers the perfect mix of comfort, character, and convenience. Inside, the inviting living room sets the tone for relaxed living, while the updated kitchen shines with new cabinetry, Quartz counters, farm sink, tiled backsplash, stainless steel appliances, and pendant lighting. Open to the dining area, it's a warm and stylish space ready for both everyday meals and memorable gatherings. The first floor features a convenient bedroom and full bath with walk-in shower, plus a laundry room with washer and dryer and direct outdoor access. Upstairs, two more bedrooms and a full bath with tub/shower provide peaceful retreats. Throughout the home, ceiling fans and abundant lighting create a bright, welcoming atmosphere. Outdoors, take some time to relax on the covered front porch while enjoying your favorite beverage. The addition of a 12' x 12' shed for storage, hobbies, or a workshop is a plus! UPDATES: New front side door, resurfaced and painted front and back porches, updated bathroom (2025), updated kitchen (2022), new modern furnace and new central air (2021), updated electrical and plumbing, replaced many windows (2017), and roof is approximately 10 years old. Wonderful location near downtown Sycamore, schools, parks, shopping, restaurants, medical facilities, and more! Everything you need is just minutes away. CHARMING, UPDATED, AND MOVE-IN READY, THIS HOME IS WAITING TO WELCOME YOU IN!
Listing Agent
Coldwell Banker Real Estate Group License #475157131 Listed on: 09/18/2025

Home Details
Home Type
- Single Family
Est. Annual Taxes
- $3,861
Year Built
- Built in 1910 | Remodeled in 2017
Lot Details
- 7,405 Sq Ft Lot
- Lot Dimensions are 90 x 40 x 115 x 25 x 50 x 50
- Corner Lot
- Paved or Partially Paved Lot
- Mature Trees
Home Design
- Asphalt Roof
Interior Spaces
- 1,103 Sq Ft Home
- 1.5-Story Property
- Built-In Features
- Ceiling Fan
- Pendant Lighting
- Window Screens
- Mud Room
- Living Room
- Dining Room
- Open Floorplan
- Carbon Monoxide Detectors
Kitchen
- Range
- Microwave
- Freezer
- Dishwasher
- Stainless Steel Appliances
- Farmhouse Sink
Flooring
- Carpet
- Laminate
Bedrooms and Bathrooms
- 3 Bedrooms
- 3 Potential Bedrooms
- Main Floor Bedroom
- Bathroom on Main Level
- 2 Full Bathrooms
- Separate Shower
Laundry
- Laundry Room
- Dryer
- Washer
Parking
- 2 Parking Spaces
- Driveway
- Parking Included in Price
Outdoor Features
- Shed
Utilities
- Forced Air Heating and Cooling System
- Heating System Uses Natural Gas
- 100 Amp Service
- Water Softener Leased
Listing and Financial Details
- Homeowner Tax Exemptions
Map
Home Values in the Area
Average Home Value in this Area
Tax History
| Year | Tax Paid | Tax Assessment Tax Assessment Total Assessment is a certain percentage of the fair market value that is determined by local assessors to be the total taxable value of land and additions on the property. | Land | Improvement |
|---|---|---|---|---|
| 2024 | $3,789 | $52,440 | $7,392 | $45,048 |
| 2023 | $3,789 | $47,886 | $6,750 | $41,136 |
| 2022 | $3,594 | $43,920 | $6,191 | $37,729 |
| 2021 | $3,399 | $41,232 | $5,812 | $35,420 |
| 2020 | $3,343 | $40,218 | $5,669 | $34,549 |
| 2019 | $3,281 | $39,337 | $5,545 | $33,792 |
| 2018 | $3,814 | $38,143 | $5,377 | $32,766 |
| 2017 | $871 | $8,547 | $5,164 | $3,383 |
| 2016 | $853 | $8,157 | $4,928 | $3,229 |
| 2015 | -- | $7,677 | $4,638 | $3,039 |
| 2014 | -- | $7,290 | $4,404 | $2,886 |
| 2013 | -- | $7,429 | $4,488 | $2,941 |
Property History
| Date | Event | Price | List to Sale | Price per Sq Ft |
|---|---|---|---|---|
| 10/21/2025 10/21/25 | Pending | -- | -- | -- |
| 10/11/2025 10/11/25 | Price Changed | $225,000 | -3.0% | $204 / Sq Ft |
| 09/18/2025 09/18/25 | For Sale | $232,000 | -- | $210 / Sq Ft |
Purchase History
| Date | Type | Sale Price | Title Company |
|---|---|---|---|
| Warranty Deed | $132,000 | Attorney | |
| Warranty Deed | $34,500 | -- | |
| Warranty Deed | $24,000 | -- | |
| Sheriffs Deed | -- | -- |
Mortgage History
| Date | Status | Loan Amount | Loan Type |
|---|---|---|---|
| Open | $123,500 | New Conventional |
Source: Midwest Real Estate Data (MRED)
MLS Number: 12474798
APN: 06-32-329-021
Disclaimer: Certain information contained herein is derived from information provided by parties other than Homes.com. All information provided is deemed reliable, but is not guaranteed to be accurate and should be independently verified.
![]() Based on information submitted to the MLS GRID. All data is obtained from various sources and may not have been verified by broker or MLS GRID. Supplied Open House Information is subject to change without notice. All information should be independently reviewed and verified for accuracy. Properties may or may not be listed by the office/agent presenting the information. Some IDX listings have been excluded from this website.
Based on information submitted to the MLS GRID. All data is obtained from various sources and may not have been verified by broker or MLS GRID. Supplied Open House Information is subject to change without notice. All information should be independently reviewed and verified for accuracy. Properties may or may not be listed by the office/agent presenting the information. Some IDX listings have been excluded from this website.
The Digital Millennium Copyright Act of 1998, 17 U.S.C. § 512 (the “DMCA”) provides recourse for copyright owners who believe that material appearing on the Internet infringes their rights under U.S. copyright law. If you believe in good faith that any content or material made available in connection with our website or services infringes your copyright, you (or your agent) may send us a notice requesting that the content or material be removed, or access to it blocked.
Notices must be sent in writing by email to DMCAnotice@MLSGrid.com.
The DMCA requires that your notice of alleged copyright infringement include the following information:
(1) description of the copyrighted work that is the subject of claimed infringement;
(2) description of the alleged infringing content and information sufficient to permit us to locate the content;
(3) contact information for you, including your address, telephone number and email address;
(4) a statement by you that you have a good faith belief that the content in the manner complained of is not authorized by the copyright owner, or its agent, or by the operation of any law;
(5) a statement by you, signed under penalty of perjury, that the information in the notification is accurate and that you have the authority to enforce the copyrights that are claimed to be infringed; and
(6) a physical or electronic signature of the copyright owner or a person authorized to act on the copyright owner’s behalf. Failure to include all of the above information may result in the delay of the processing of your complaint.
- 822 Dekalb Ave
- 419 W Ottawa St
- 412 W Elm St
- 740 W State St
- 224 S Maple St
- 521 Victor St
- Lot 1 Route 23
- 732 Park Ave
- 916 Albert Ave
- 660 South Ave
- 1936 Galloway Ct
- 1929 Galloway Ct
- 113 E Ottawa St
- 211 E Ottawa St
- 321 N Locust St
- 335 North Ave
- 1134 Somonauk St
- 966 Constance Ln
- 434 E Exchange St Unit 2
- 459 E State St