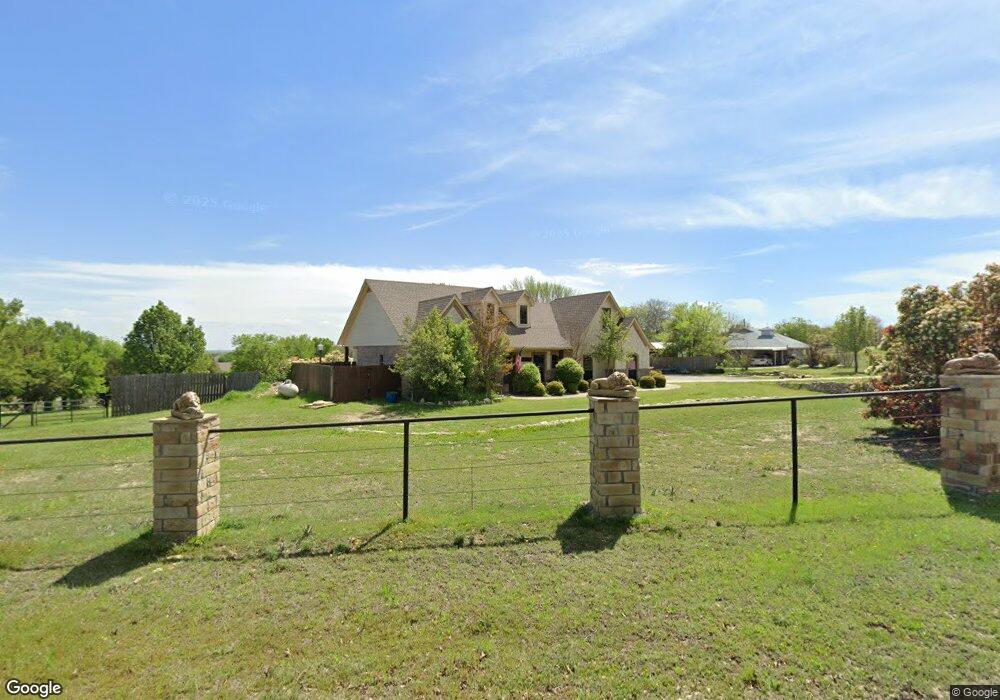
410 Trailwood Dr Weatherford, TX 76085
Estimated Value: $497,539 - $545,000
4
Beds
3
Baths
2,300
Sq Ft
$227/Sq Ft
Est. Value
About This Home
This home is located at 410 Trailwood Dr, Weatherford, TX 76085 and is currently estimated at $522,635, approximately $227 per square foot. 410 Trailwood Dr is a home located in Parker County with nearby schools including Martin Elementary School, Tison Middle School, and Weatherford High School.
Ownership History
Date
Name
Owned For
Owner Type
Purchase Details
Closed on
Nov 21, 2017
Sold by
Berry Jason L and Berry Heather
Bought by
Kaifetz Jerry D and Kaifetz Gwen D
Current Estimated Value
Home Financials for this Owner
Home Financials are based on the most recent Mortgage that was taken out on this home.
Original Mortgage
$300,000
Interest Rate
3.88%
Mortgage Type
Commercial
Purchase Details
Closed on
Jun 3, 2008
Sold by
Rado Scott R
Bought by
Berry Jason L
Home Financials for this Owner
Home Financials are based on the most recent Mortgage that was taken out on this home.
Original Mortgage
$217,283
Interest Rate
6.07%
Mortgage Type
Purchase Money Mortgage
Purchase Details
Closed on
Jul 10, 2006
Sold by
Rising Star Development Lp
Bought by
Berry Jason J
Purchase Details
Closed on
Mar 12, 2003
Bought by
Berry Jason J
Create a Home Valuation Report for This Property
The Home Valuation Report is an in-depth analysis detailing your home's value as well as a comparison with similar homes in the area
Home Values in the Area
Average Home Value in this Area
Purchase History
| Date | Buyer | Sale Price | Title Company |
|---|---|---|---|
| Kaifetz Jerry D | -- | Sewell Title Co | |
| Berry Jason L | -- | Fnt | |
| Berry Jason J | -- | -- | |
| Berry Jason J | -- | -- | |
| Berry Jason J | -- | -- |
Source: Public Records
Mortgage History
| Date | Status | Borrower | Loan Amount |
|---|---|---|---|
| Closed | Kaifetz Jerry D | $300,000 | |
| Previous Owner | Berry Jason L | $217,283 |
Source: Public Records
Tax History Compared to Growth
Tax History
| Year | Tax Paid | Tax Assessment Tax Assessment Total Assessment is a certain percentage of the fair market value that is determined by local assessors to be the total taxable value of land and additions on the property. | Land | Improvement |
|---|---|---|---|---|
| 2025 | $2,570 | $443,150 | $75,000 | $368,150 |
| 2024 | $2,570 | $432,949 | -- | -- |
| 2023 | $2,570 | $393,590 | $0 | $0 |
| 2022 | $6,662 | $372,610 | $50,000 | $322,610 |
| 2021 | $6,566 | $372,610 | $50,000 | $322,610 |
| 2020 | $5,998 | $342,200 | $30,000 | $312,200 |
| 2019 | $5,817 | $342,200 | $30,000 | $312,200 |
| 2018 | $5,316 | $244,390 | $30,000 | $214,390 |
| 2017 | $5,425 | $244,390 | $30,000 | $214,390 |
| 2016 | $5,217 | $235,060 | $30,000 | $205,060 |
| 2015 | $5,148 | $235,060 | $30,000 | $205,060 |
| 2014 | $4,114 | $203,170 | $30,000 | $173,170 |
Source: Public Records
Map
Nearby Homes
- 2526 Hayley Dr
- 777 Trailwood Dr
- 408 Sandridge Dr
- 2517 Hayley Dr
- 116 Sandstone Ln
- 1301 Eagle Dr
- 1337 Eagle Dr
- 1305 Green Ridge Rd
- Haven Plan at Wossum Ranch
- 1300 Green Ridge Rd
- Vista Plan at Wossum Ranch
- 106 Rambling Trail
- 1605 Stanchion Way
- 1541 Stanchion Way
- 1624 Sandle Wood Dr
- 1201 Azle Hwy
- 1629 Silverstone Dr
- 1860 Trailwood Dr
- 1553 Salado Trail
- 2712 Sonora Canyon Rd
- 102 Canyon Rd
- 400 Trailwood Dr
- 2548 Hayley Dr
- 397 Trailwood Dr
- 385 Trailwood Dr
- 2543 Hayley Dr
- 591 Trailwood Dr
- 2544 Hayley Dr
- 2544 Hayley Dr
- 371 Trailwood Dr
- 217 Canyon Rd
- 220 Canyon Rd
- 300 Trailwood Dr
- 611 Trailwood Dr
- 2535 Hayley Dr
- 333 Trailwood Dr
- 278 Canyon Rd
- 701 Trailwood Dr
- 285 Trailwood Dr
- 432 Sandridge Dr