NOT LISTED FOR SALE

410 W 9th St Seymour, IN 47274

Estimated Value: $176,038 - $188,000

3 Beds
2 Baths
1,284 Sq Ft
$142/Sq Ft Est. Value

Last Sold March 13, 2014

Last sale price $94,500 $74 Per Sq Ft

Est. 93% increase in value since last sale

Current estimated payment $1,039/month

62 Days on Market

About This Home

As of March 2014

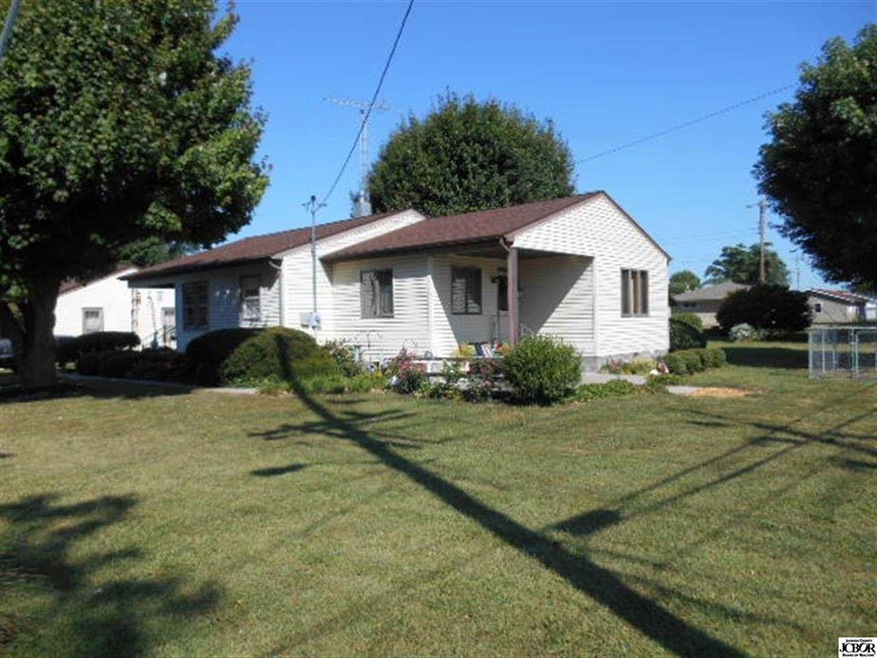
This home is located at 410 W 9th St, Seymour, IN 47274 since 06 September 2013 and is currently estimated at $182,760, approximately $142 per square foot. This property was built in 1953. 410 W 9th St is a home located in Jackson County with nearby schools including Seymour-Redding Elementary School, Seymour Middle School, and Seymour Senior High School.

Last Agent to Sell the Property

Tani Johnson

Berkshire Hathaway Home Listed on: 09/06/2013

Berkshire Hathaway Home

Home Details

Home Type

  • Single Family

Est. Annual Taxes

  • $420

Year Built

  • 1953

Lot Details

  • 0.34

Parking

  • Detached Garage

Utilities

  • Heating System Uses Gas
  • Gas Water Heater

Home Details

Home Type

Single Family

Est. Annual Taxes

$420

Year Built

1953

Lot Details

0

Parking

1

Listing Details

  • Property Type: Residential
  • Property Sub Type: Single Family Residence
  • Architectural Style: Ranch
  • Directions: North on Pine to 9th St Corner of 9th & Pine
  • Garage Yn: Yes
  • New Construction: No
  • Property Attached Yn: No
  • Subdivision Name: SUBDIVISION NOT AVAILABLE See Legal
  • Special Features: None
  • Year Built: 1953

Interior Features

  • Appliances: Dryer, Gas Oven, Refrigerator, Free-Standing Freezer, Washer
  • Fireplace Features: None
  • Main Level Full Bathrooms: 2
  • Sq Ft Main Upper: 1284
  • Main Level Sq Ft: 1284
  • Main Half Bathrooms: 0
  • Master Bedroom Description: Closet Walk in
  • Bathroom Areas: 6.0000
  • Basement YN: No
  • Full Bathrooms: 2
  • Total Bedrooms: 3
  • Interior Amenities: Storms Some, Windows Thermal, Windows Wood, WoodWorkStain/Painted

Exterior Features

  • Exterior Features: Driveway Exposed Aggregate
  • Foundation Details: Block
  • Association Maintained Building Exterior: 0
  • Fence: 483
  • Construction Type: Vinyl Siding

Garage/Parking

  • Fuel: Gas
  • Garage Parking Description: Detached
  • Garage Spaces: 1

Utilities

  • Cooling: Central Air
  • Water Heater: Gas
  • Sewer: Municipal Sewer On Site, Sewer Connected
  • Water Source: Public

Lot Info

  • Acres: <1/2 Acre
  • Lot Information: Sidewalks,Street Lights,Tree Mature
  • Lot Size: 50x150 & 48x150
  • Zoning: 10.4x10.8

Tax Info

  • Semi Annual Property Tax Amt: 210
  • Tax Exemption: HomesteadTaxExemption
  • Tax Annual Amount: 420

MLS Schools

  • School District: Seymour Community
  • Schools: Seymour Elementary School,Seymour High

Ownership History

Date Name Owned For Owner Type

Purchase Details

Listed on
Sep 6, 2013
Closed on
Mar 13, 2014
Sold by
Oberring Jeanette J
Bought by
Day Joshua R and Day Jessica
Seller's Agent
Tani Johnson
Berkshire Hathaway Home
List Price
$110,000
Sold Price
$94,500
Premium/Discount to List
-$15,500
-14.09%
Current Estimated Value
$182,760

Home Financials for this Owner

Home Financials are based on the most recent Mortgage that was taken out on this home.
Estimated Appreciation
$88,260
Avg. Annual Appreciation
5.58%
Original Mortgage
$96,428
Outstanding Balance
$74,018
Interest Rate
4.29%
Mortgage Type
New Conventional
Estimated Equity
$102,905
Source: Public Records

Range of Values:

Collateral Analytics

Collateral Analytics Collateral Analytics AVMs (Automated Valuation Model) employ a number of statistical approaches combined with neighborhood-specific comparable selection guarantees the most up-to-date and precise valuations.

Not Available

Collateral Analytics does not have data for the current month. Please view the chart for historical values.

ICE

ICE Mortgage Technology ICE Mortgage Technology’s AVM (Automated Valuation Model) is a state-of-the-art online residential property valuation tool that provides a quick and accurate estimate of the value of almost any home in the U.S.

Not Available

ICE Mortgage Technology does not have data for the current month. Please view the chart for historical values.

First American

First American First American Data & Analytics’ next-generation AVM combines unrivaled data assets with a blended ensemble of valuation models to produce highly accurate, reliable valuations you can trust.

Not Available

First American does not have data for the current month. Please view the chart for historical values.

Quantarium

Quantarium Quantarium’s valuation service, repeatedly proven the industry’s most accurate and comprehensive, is supercharged with a self-learning and auto-tuning AI engine that continually becomes smarter and more accurate as it processes daily inputs from the industry’s leading RE data lake.

Not Available

Quantarium does not have data for the current month. Please view the chart for historical values.

Average Value
Not Available
List Price
Sold Price
Create a Home Valuation Report for This Property
The Home Valuation Report is an in-depth analysis detailing your home's value as well as a comparison with similar homes in the area

Home Values in the Area

Source: Public Records

Average Home Value in this Area


Source: Public Records

Purchase History

Date Buyer Sale Price Title Company
Day Joshua R -- --
Source: Public Records

Mortgage History

Date Status Borrower Loan Amount
Open Day Joshua R $96,428
Source: Public Records

Property History

Date Event Price Change Sq Ft Price
03/13/2014 03/13/14 Sold $94,500 -14.1% $74 / Sq Ft
11/08/2013 11/08/13 Pending -- -- --
09/06/2013 09/06/13 For Sale $110,000 -- $86 / Sq Ft
Source: MIBOR Broker Listing Cooperative®

Tax History Compared to Growth

Source: Public Records

Tax History

Year Tax Paid Tax Assessment Tax Assessment Total Assessment is a certain percentage of the fair market value that is determined by local assessors to be the total taxable value of land and additions on the property. Land Improvement
2024 $839 $108,300 $20,400 $87,900
2023 $945 $116,100 $20,400 $95,700
2022 $800 $104,800 $20,400 $84,400
2021 $576 $93,700 $20,400 $73,300
2020 $552 $93,100 $20,400 $72,700
2019 $649 $101,600 $20,400 $81,200
2018 $644 $101,600 $20,400 $81,200
2017 $597 $89,300 $20,400 $68,900
2016 $553 $97,400 $20,400 $77,000
2014 $267 $79,400 $20,400 $59,000
2013 $267 $68,500 $10,000 $58,500
Source: Public Records

Agents Affiliated with this Home

  • Section Image
See All Agents

Map

Source: MIBOR Broker Listing Cooperative®

MLS Number: 1173983J

MIBOR Broker Listing Cooperative®

APN: 36-66-18-102-007.000-009