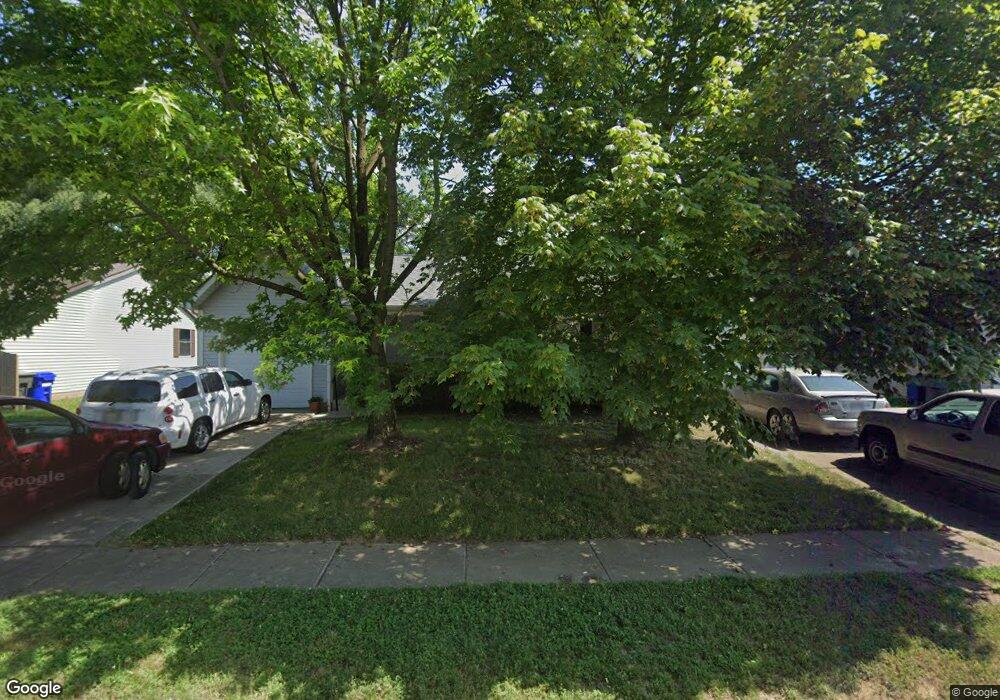
4100-4102 Greenery Dr Columbus, OH 43207
Obetz-Lockbourne NeighborhoodEstimated Value: $244,000 - $276,878
6
Beds
2
Baths
1,872
Sq Ft
$141/Sq Ft
Est. Value
About This Home
This home is located at 4100-4102 Greenery Dr, Columbus, OH 43207 and is currently estimated at $264,220, approximately $141 per square foot. 4100-4102 Greenery Dr is a home located in Franklin County with nearby schools including Groveport Madison High School, South Columbus Preparatory Academy at Southfield, and South Scioto Academy.
Ownership History
Date
Name
Owned For
Owner Type
Purchase Details
Closed on
Sep 28, 2020
Sold by
Block Sean
Bought by
Taylor Asia
Current Estimated Value
Home Financials for this Owner
Home Financials are based on the most recent Mortgage that was taken out on this home.
Original Mortgage
$132,600
Outstanding Balance
$117,726
Interest Rate
2.8%
Mortgage Type
New Conventional
Estimated Equity
$146,494
Purchase Details
Closed on
Jul 31, 2007
Sold by
Rollison Susan D and Rollison Ray
Bought by
Block Sean
Home Financials for this Owner
Home Financials are based on the most recent Mortgage that was taken out on this home.
Original Mortgage
$138,000
Interest Rate
8.87%
Mortgage Type
Purchase Money Mortgage
Purchase Details
Closed on
Apr 28, 1993
Bought by
Rissler Susan D
Purchase Details
Closed on
Jun 1, 1987
Purchase Details
Closed on
Feb 1, 1987
Create a Home Valuation Report for This Property
The Home Valuation Report is an in-depth analysis detailing your home's value as well as a comparison with similar homes in the area
Home Values in the Area
Average Home Value in this Area
Purchase History
| Date | Buyer | Sale Price | Title Company |
|---|---|---|---|
| Taylor Asia | $156,000 | Crown Search Services | |
| Block Sean | $138,000 | Attorney | |
| Rissler Susan D | -- | -- | |
| -- | $262,500 | -- | |
| -- | $10,000 | -- |
Source: Public Records
Mortgage History
| Date | Status | Borrower | Loan Amount |
|---|---|---|---|
| Open | Taylor Asia | $132,600 | |
| Previous Owner | Block Sean | $138,000 |
Source: Public Records
Tax History Compared to Growth
Tax History
| Year | Tax Paid | Tax Assessment Tax Assessment Total Assessment is a certain percentage of the fair market value that is determined by local assessors to be the total taxable value of land and additions on the property. | Land | Improvement |
|---|---|---|---|---|
| 2024 | $3,691 | $85,050 | $19,250 | $65,800 |
| 2023 | $3,765 | $85,050 | $19,250 | $65,800 |
| 2022 | $1,484 | $26,120 | $7,250 | $18,870 |
| 2021 | $1,488 | $26,120 | $7,250 | $18,870 |
| 2020 | $1,341 | $26,120 | $7,250 | $18,870 |
| 2019 | $1,454 | $22,720 | $6,300 | $16,420 |
| 2018 | $1,954 | $22,720 | $6,300 | $16,420 |
| 2017 | $1,893 | $22,720 | $6,300 | $16,420 |
| 2016 | $2,420 | $37,380 | $6,300 | $31,080 |
| 2015 | $2,446 | $37,380 | $6,300 | $31,080 |
| 2014 | $2,423 | $37,380 | $6,300 | $31,080 |
| 2013 | $2,189 | $39,340 | $6,615 | $32,725 |
Source: Public Records
Map
Nearby Homes
- 2585 Millview Dr
- 0 Alum Creek Dr Unit 225007823
- 2318 Rodger Rd
- 3865 Pendent Ln
- 2229 Maureen Blvd N
- 2222 Maureen Blvd S
- 2587 Winningwillow Dr
- 4310 Charlotte Rd
- 3622 Pendent Ln
- 3724 Revolutionary Dr Unit 111
- 2629 Patrick Henry Ave Unit 40
- 2681 Meigs Dr
- 2685 Meigs Dr
- 2689 Meigs Dr
- 2693 Meigs Dr
- 2697 Meigs Dr
- 3242 Mackinac Dr
- 2670 Meigs Dr
- 2674 Meigs Dr
- 2682 Meigs Dr
- 4100 Greenery Dr Unit 102
- 4108 Greenery Dr Unit 110
- 4108 Greenery Dr Unit 2
- 4092-4094 Greenery Dr
- 4092 Greenery Dr Unit 94
- 4074 Millview Ct
- 4084-4086 Greenery Dr
- 4099 Acres Dr Unit 101
- 4084 Greenery Dr Unit 86
- 4099-4101 Acres Dr
- 4103 Greenery Dr
- 4095 Acres Dr
- 4105 Greenery Dr Unit 103
- 4069 Millview Ct
- 4109 Greenery Dr Unit 111
- 4095 Greenery Dr Unit 97
- 4095-4097 Greenery Dr
- 4066 Millview Ct
- 4087 Acres Dr
- 4117 Greenery Dr